Steemit Crypto Academy Temporada 2-Semana6 | Comercio de criptomonedas con indicador MACD por @kouba01 / Participante @adriancabrera
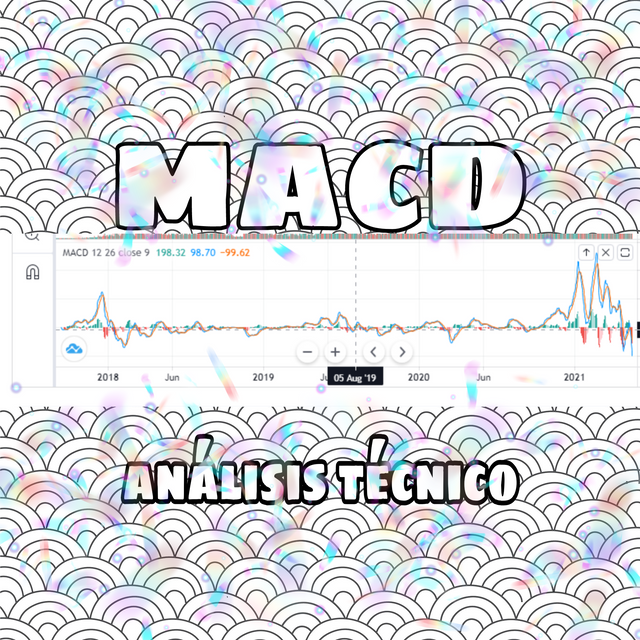
Buenos días para todos, en está oportunidad quiero cumplír con la tarea enviada por el profesor @kouba01 a quien felicito por tan excelente clase, realmente he aprendido mucho de ella espero estar acertado en mis respuestas.
Good morning everyone, this time I want to complete the task sent by teacher @ kouba01 whom I congratulate for such an excellent class, he really learned a lot from her, I hope I am correct in my answers.
¿Qué es simplemente el indicador MACD?
El MACD viene siendo una media móvil de convergencia y divergencia.
Para entender un poco mejor al MACD te comento que es una media móvil que utiliza varias medias móviles, su composición consta de 3 elementos, es decir tres herramientas clasificadas de la siguiente manera
Let's start
What is simply the MACD indicator?
The MACD has been a moving average of convergence and divergence.
To understand the MACD a little better, I will tell you that it is a moving average that uses several moving averages, its composition consists of 3 elements, that is, three tools classified as follows
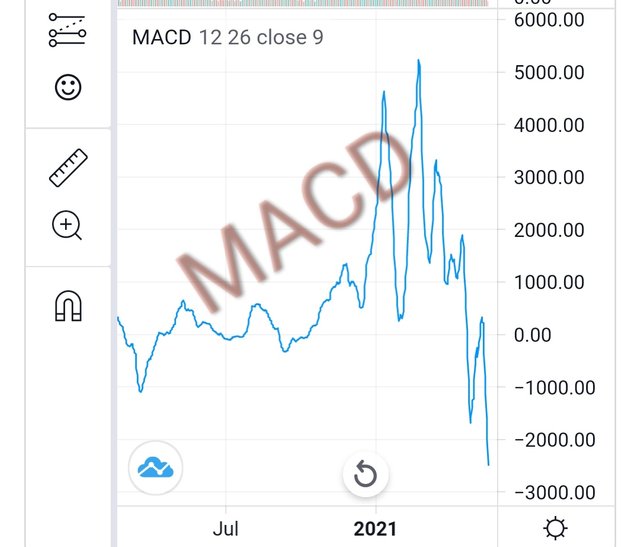
qué es la diferencia entre las medias móviles exponenciales mediante una longitud, hay que resaltar que esa longitud fue establecida por su creador donde maneja un estándar de 12 por 26 que permíte que en compañía de otras herramientas pueda avisar de manera anticipada para actuar en la transacción
what is the difference between exponential moving averages by means of a length, it should be noted that this length was established by its creator where it handles a standard of 12 by 26 that allows it in the company of other tools to notify in advance to act on the transaction
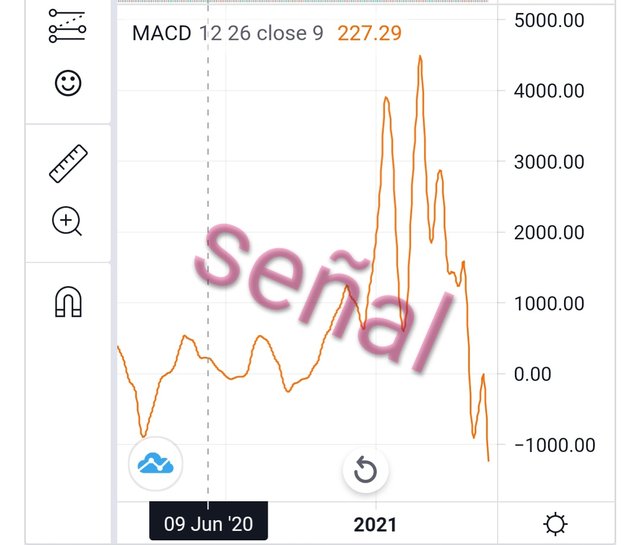
es esa de las herramientas necesarias para el buen funcionamiento del MACD ya que es la que nos dará los puntos de corte que nos indicara entradas y salidas tanto para arriba como para abajo,esto se explicaría de la siguiente manera corte subiendo estaríamos en compra y corte bajando estaríamos en venta y por último el historigrama
It is that of the necessary tools for the proper functioning of the MACD since it is the one that will give us the cut-off points that will indicate entries and exits both up and down, this would be explained in the following way, cutting going up, we would be buying and cutting going down we would be for sale and finally the history chart
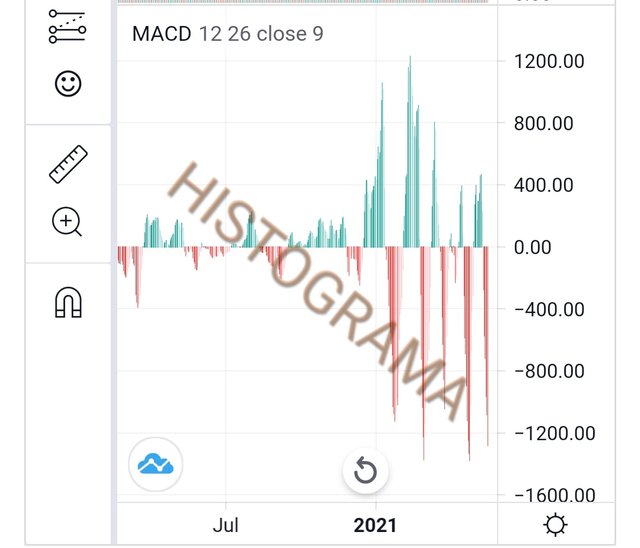
el cual vendría siendo la medida media entre la señal y el MACD, es decir parte desde cero con la intención de acercar más las predicciones avisando mediante sus curvaturas.
which would be the average measurement between the signal and the MACD, that is to say, it starts from zero with the intention of bringing the predictions closer together by warning through their curvatures.
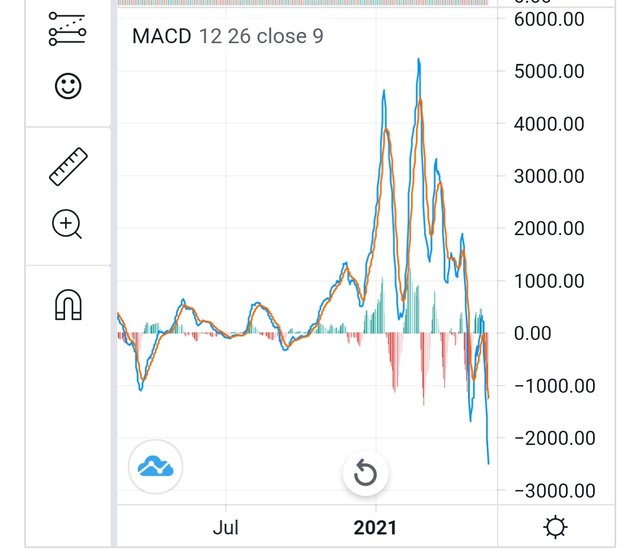
All tools together
¿Es el indicador MACD bueno para operar con criptomonedas?
Su reputación como uno de los indicadores más efectivos del mercado me lleva a contestar afirmativamente, adicional a esto los expertos manifiestan que fue uno de los pocos que han resistido a la prueba de tiempo con éxito.
Otra de las cosas que hay que saber es que para operar con MACD hay que tener paciencia ya que es una herramienta que se maneja con periodos largos es decir que si vas a una inversión corta no es recomendable ya que los lapsos para sus señales llevan tiempo, y aunque la alta Volatilidad de las criptomonedas no le dan seguridad a nadien, yo pienso que si nos manejamos correctamente y agregamos otra herramientas complementarias, pudiera ser bueno para las criptomonedas.
Is the MACD indicator good for trading cryptocurrencies?
Its reputation as one of the most effective indicators in the market leads me to answer affirmatively, in addition to this, experts say that it was one of the few that have successfully withstood the test of time.
Another thing to know is that to operate with MACD you have to be patient since it is a tool that is handled with long periods, that is to say that if you go to a short investment it is not recommended since the lapses for its signals take time , and although the high volatility of cryptocurrencies does not give security to anyone, I think that if we handle ourselves correctly and add other complementary tools, it could be good for cryptocurrencies.
¿Qué es mejor, MACD o RSI?
Lo primero que tenemos que saber es que los dos oxiladores se manejan con diferentes estándar y eso conlleva hacer efectivo cada uno en diferentes negociaciones, leyendo un poco e investigando podemos ver que el rsi no es el más popular,pero según expertos indican que si el más efectivo esto Gracias a su versatilidad y la forma cómo realizar sus cálculos, a pesar de esto muchos de los tráider se manejan con el Macd ya que funciona en los movimientos alcista como bajistas midiendo la fortaleza del movimiento de los diferentes precios otra de sus ventajas y razón de la preferencia de los tráider es que que gracias a su historigrama se pueden confirmar las señales incluso antes del momento de los cruces, también se muestra más fácil de manejar caso contrario al rsi que aunque también es un poco fácil de utilizar tiene algo de complejidad y la limitante de 70-30 en cuanto a su estadar, son tantas las comparaciones pero vuelvo y repito todo dependerá de que tipo de traidig vayas hacer.
Pero lo cierto del caso es que si combinamos su uso tendríamos un mejor anticipo, que como todo en el criptomercado no será 100% efectivo, pero si nos dará un poco más de tranquilidad al ver que los dos oxiladores coinciden.
Which is better, MACD or RSI?
The first thing we have to know is that the two oxilators are handled with different standards and that entails making each one effective in different negotiations, reading a little and investigating we can see that the rsi is not the most popular, but according to experts they indicate that if the This is more effective Thanks to its versatility and the way to carry out its calculations, despite this many of the traders are handled with the Macd since it works in bullish and bearish movements, measuring the strength of the movement of different prices, another of its advantages And the reason for the preference of the traider is that thanks to its history chart, the signals can be confirmed even before the time of the crossings, it is also easier to handle otherwise the rsi that although it is also a bit easy to use it has something of complexity and the limitation of 70-30 in terms of its standard, there are so many comparisons but I go back and repeat everything will depend on what type of traidig you are going to do.
But the truth of the case is that if we combine its use we would have a better advance, which like everything in the crypto market will not be 100% effective, but it will give us a little more peace of mind when seeing that the two oxilators coincide.

¿Cómo agregar el indicador MACD al gráfico, cuáles son sus configuraciones y formas de beneficiarse de ellas?
Lo primero que debemos hacer es entrar a cualquier indicator gráfico, yo en mi caso entraré en Coin-marketcap , elegiré la moneda theter para mí ejemplo.
How to add the MACD indicator to the chart, what are its settings and ways to profit from them?
The first thing we must do is enter any graphic indicator, in my case I will enter the Coin-marketcap, I will choose the theter currency for my example.
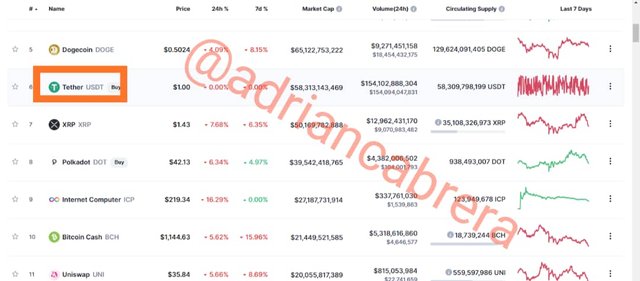
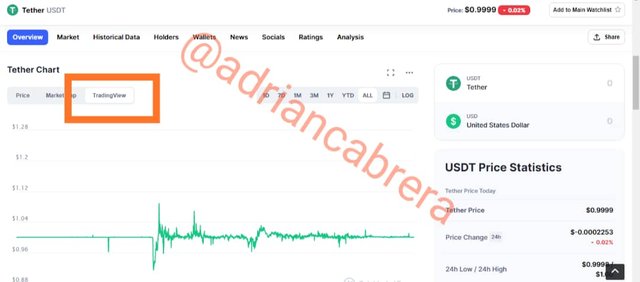
Luego nos vamos al gráfico y selecciónamos a donde dice TraidigView
Then we go to the graph and select where TraidigView says
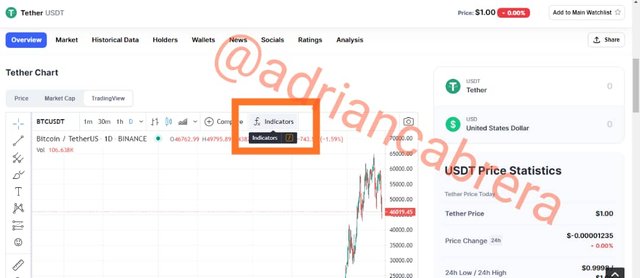
Selecciónaremos la pestaña indicator
We will select the indicator tab
escribimos en el buscador MACD y presionamos.
we write in the MACD search engine and press.
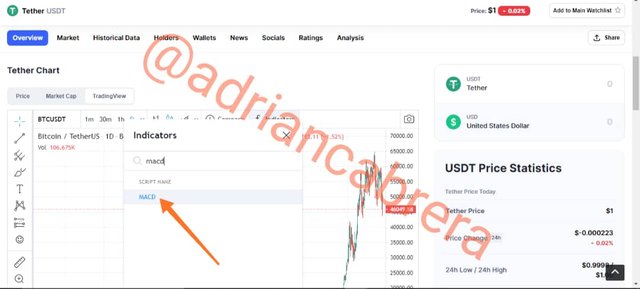
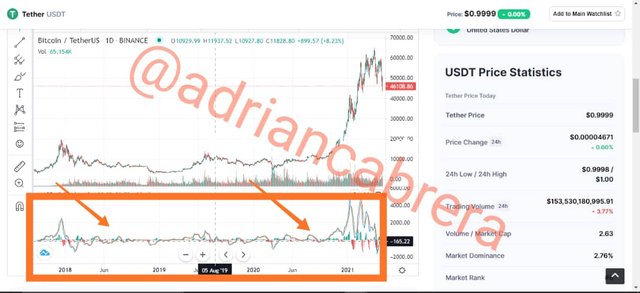
Y aquí apreciaremos el MACD en el gráfico ahora vayamos al su configuración.
And here we will appreciate the MACD in the chart now let's go to its configuration.
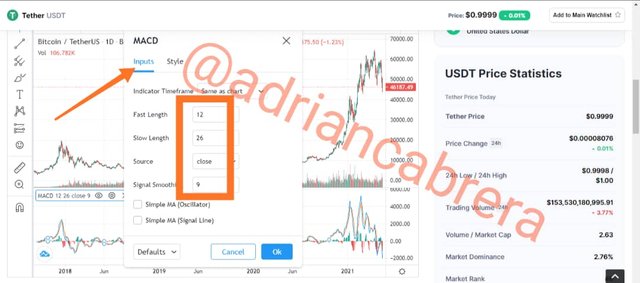
Aquí en imput veremos sus parámetros, longitud lapsos, tiempo etc.
Here in imput we will see its parameters, length of lapses, time etc.
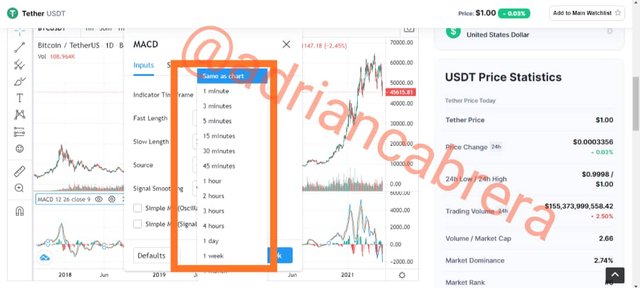
Aquí podrás establecer tiempos en cuanto a minutos segundos todo depende de tu estrategia.
Here you can set times in terms of minutes seconds everything depends on your strategy.
Ahora vamos con Style que sirve para personalizar el Macd definiendo colores e incluso dejar solamente alguna de las herramientas para cualquier análisis.
Now we go with Style that serves to customize the Macd defining colors and even leave only some of the tools for any analysis.
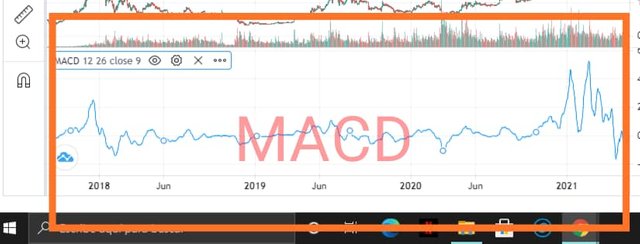
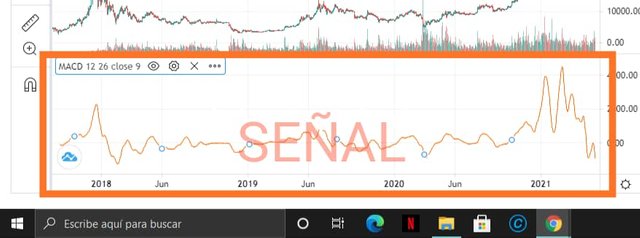

En cuanto a los beneficios de la configuración de MACD en nuestro gráfico, nos permite identificar las tendencias del criptomercado en las distintas fases de corrección e impulso también captar señales de entradas, tendencia y contra-tendencia, está herramienta es muy completa a parte te ofrece muchas alternativas,todo va a depender de lo que busques a la hora de la operación.
Regarding the benefits of the MACD configuration in our chart, it allows us to identify the trends of the crypto market in the different phases of correction and momentum, as well as capture entry signals, trend and counter-trend, this tool is very complete and offers you many alternatives, everything will depend on what you are looking for at the time of the operation.
¿Cómo utilizar MACD para cruzar la línea MACD y la línea de señal?
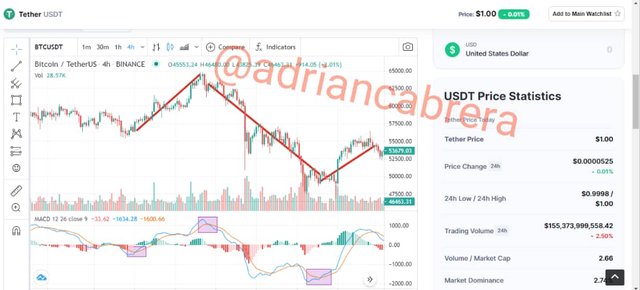
Este gráfico lo tome en base a las últimas 4 horas dónde podemos apreciar el cruce de la línea MACD y la línea de señal y podemos ver cómo presenta un alza, pero no duró mucho ya que luego experimento una tremenda caída.
How to use MACD to cross the MACD line and the signal line?
I took this chart based on the last 4 hours where we can see the crossing of the MACD line and the signal line and we can see how it presents a rise, but it did not last long since then I experienced a tremendous fall.
¿Y cómo utilizar el MACD con el cruce de la línea cero?
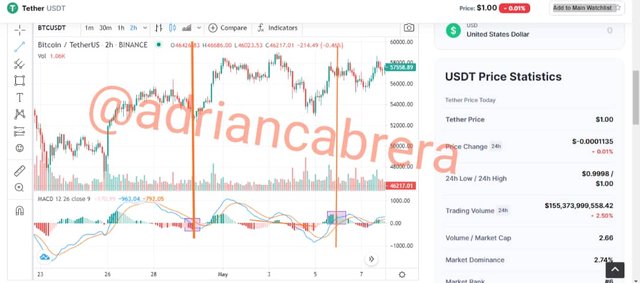
Aquí podemos apreciar el momento que pasa el macd por la línea cero primero anunciando una baja y luego anunciando la alta.
¿And how to use the MACD with the crossing of the zero line? **
Here we can see the moment that the macd passes through the zero line, first announcing a low and then announcing the high.
¿Cómo detectar una tendencia usando el MACD? ¿Y cómo filtrar las señales falsas?
La forma más segura de detectar una tendencia es atendiendo al HISTOGRAMA ya que cómo pueden ver en el gráfico el se adelanta Incluso más rápido que la señal y el MACD, si pueden ver cuando comienza el anuncio todavía mantiene la tendencia contraria en el gráfico cuestión que a muchos puede confundir. Pero lo cierto del caso es que cuando el HISTOGRAMA comienza su anuncio tendremos la tendencia correcta para tomar la decisión de nuestra próxima acción.
How to detect a trend using the MACD? And how to filter false signals?
The safest way to detect a trend is by paying attention to the HISTOGRAM since how you can see on the chart it is ahead Even faster than the signal and the MACD, if you can see when the announcement begins it still maintains the opposite trend on the chart. many may be confused. But the truth of the case is that when the HISTOGRAM begins its announcement we will have the correct tendency to make the decision of our next action.
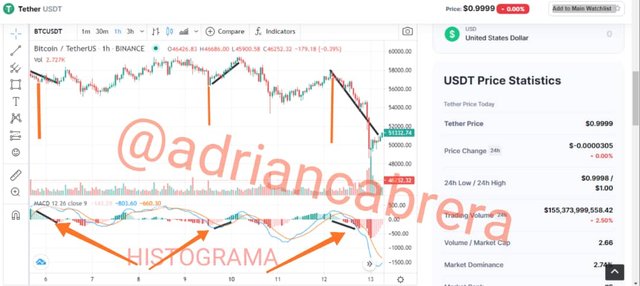
Ahora en cuanto a la forma de detectar la posibilidad de señal falsa se manifiesta cuando la línea MACD atiende la señal más baja del precio por lo tanto cuando sube a su máximo la MACD le sigue, ahora para poder entender esto hay que hablar de la divergencia tanto alcista como bajistas ya que si no le entendemos difícilmente descubramos la señales falsas.
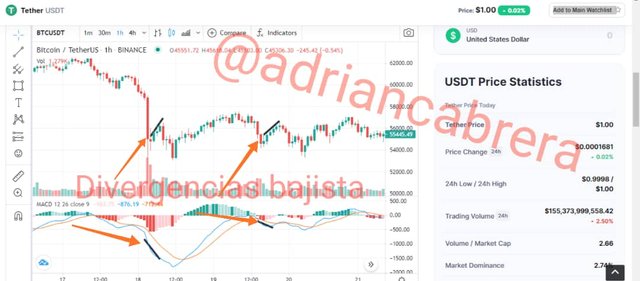
Divergencia bajista
Podemos describirla como un grupo de mínimos decreciente y maximos decreciente, es decir que la divergencia entre MACD y el actual precio se manifiestan en un máximo creciente el precio estaria acabando con la antigua tendencia.
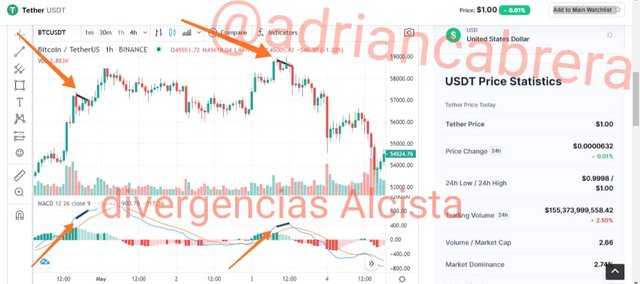
Divergencia Alcista se produce cuando su tendencia es baja pero su indicación manifiesta una alza pero desde los mínimos.
Para poder detectar le estaremos explicando mediante un gráfico y sus ejemplos.
Now as for how to detect the possibility of a false signal, it manifests itself when the MACD line attends the lowest price signal, therefore when it rises to its maximum the MACD follows it, now to understand this we must talk about the divergence both bullish and bearish because if we do not understand it, we will hardly discover the false signals.
Bearish divergence
We can describe it as a group of decreasing minimums and decreasing maximums, that is to say that the divergence between MACD and the current price is manifested in a rising maximum, the price would be ending the old trend.
Bullish Divergence occurs when its trend is low but its indication shows an increase but from the lows.
In order to detect it, we will be explaining you by means of a graph and its examples.
Divergencia bajista
Bearish divergence
Divergencia Alcista
Bullish divergence
¿Cómo se puede utilizar el indicador MACD para extraer puntos o niveles de soporte y resistencia en el gráfico?
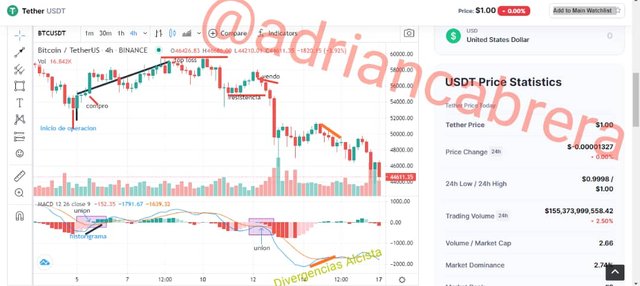
Con respecto a mi ejemplo y la estrategia a seguir podemos ver qué tomamos como punto de partida el historigrama que coinside con la unión de ellas dos líneas de la señal y el MACD anunciando una posible alza es por lo que entro con una compra, estableciendo nuna top loss cerca del punto de partida, de igual manera top loss en lo más alto, esto con la intención de tener límites a favor o en contra, y en el gráfico verán nuevamente la unión de la señal con MACD para vender, al final de el gráfico se nos presenta una divergencia Alcista en la cuál hay que saber que acción a tomar ya que se manifiesta como una falsa señal.
How can the MACD indicator be used to extract support and resistance points or levels on the chart?
Regarding my example and the strategy to follow, we can see that we take as a starting point the history chart that coincides with the union of the two lines of the signal and the MACD announcing a possible rise is why I enter with a purchase, establishing nuna top loss near the starting point, likewise top loss at the top, this with the intention of having limits in favor or against, and on the chart you will see the union of the signal with MACD again to sell, at the end of The graph presents us with a Bullish divergence in which we must know what action to take as it manifests as a false signal.
Revise el gráfico de cualquier par y presente las diversas señales del MACD.
Check the chart of any pair and present the various MACD signals.
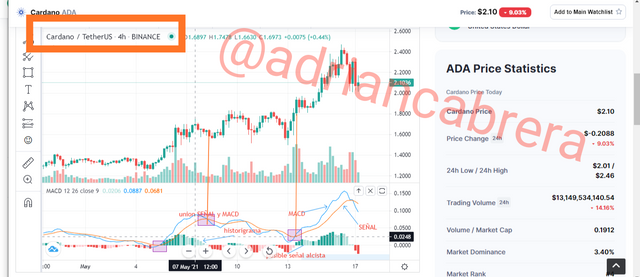
En este gráfico tomamos la criptomoneda Cardano y su par Theter y anexamos las diferentes señales, línea MACD línea de señal historigrama unión macd y señal posible alza desde el historigrama, alza desde la unión macd señal.
Adicional tome otra capture donde lo emplearé de manera conjunto con la herramienta RSI y asi hacer la comparación y confirmar las diferentes señales
history chart union macd and signal possible rise from the history chart, rise from the union macd signal.
Additional take another capture where I will use it in conjunction with the RSI tool and thus make the comparison and confirm the different signals
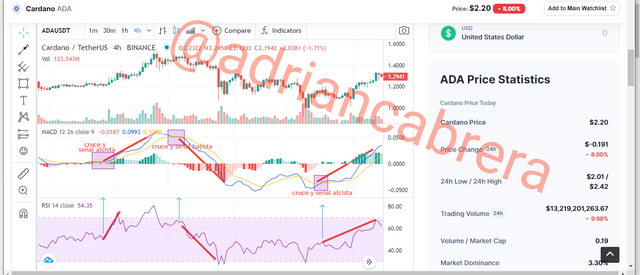
como pudieron ver las dos herramientas manifestaban lo mismo aunque el MACD se adelantaba más a las Predicciones.
Conclusión
Fue una excelente clase que nos llevó a reforzar la cátedra dónde aprendimos del RSI además que sumamos aprendizaje que seran de gran ayuda para nuestro futuro en el criptomercado y les soy sincero al principio pensaba que iba a ser más complicado pero no ya que todo es una secuencia dónde solo hay que dedicar tiempo al aprendizaje.
En cuanto a los puntos de la clase la divergencia es de cuidado ya que nos puede tirar cualquier operación, las diferentes señales son de gran ayuda para poder tener éxito, y más que ver una rivalidad entre MACD y RSI creo que tomando las dos como aliadas nos podría ir mejor.
De esta manera me despido agradeciendo por su atención y como siempre a la espera de ser evaluado.
It was an excellent class that led us to reinforce the chair where we learned from the RSI in addition to adding learning that will be of great help for our future in the crypto market and I am honest with you at first I thought it was going to be more complicated but not since everything is a sequence where you just have to spend time learning.
Regarding the points of the class, the divergence is careful since any operation can be thrown at us, the different signals are of great help to be successful, and more than seeing a rivalry between MACD and RSI I think that taking the two as allies we could do better.
In this way I say goodbye thanking you for your attention and as always waiting to be evaluated.
La Edición de la portada la realice en la aplicación PicsArt y los captures fueron sacado de la página Coin Market cap.
The Edition of the cover was done in the PicsArt application and the captures were taken from the Coin Market cap page.
Hello @adriancabrera,
Thank you for participating in the 6th Week Crypto Course in its second season and for your efforts to complete the suggested tasks, you deserve a 7/10 rating, according to the following scale:
My review :
Good content enables you to answer most questions clearly, but there are some points that you did not address or your analysis of it was not deep.
Thanks again for your effort, and we look forward to reading your next work.
Sincerely,@kouba01
Muchas gracias profesor seguire esforzándome.