Steemit Crypto Academy Temporada 2-Semana4 | Comercio de criptomonedas con RSI/@koubai01 /by @adriancabrera
Un saludo muy especial a los amigos de la criptoacademia en especial al profesor @kubai01, por aquí venimos recargados para seguir aprendiendo.
Comenzamos.
A very special greeting to the friends of the crypto-academy, especially to professor @ kubai01, here we come recharged to continue learning.
We begin.
✓ ¿Qué es el índice de fuerza relativa - RSI y cómo se calcula?
El índice de la fuerza relativa, consiste en un análisis técnico que se encarga de predecir las posibles tendencias mediante el examen de acción anticipado, haciendo notar su presencia en cryptomercados y también en los mercados tradicionales, es importante saber que son una herramienta indispensable para traider que buscan el éxito en sus negociaciones, teniendo como principio predecir los movimientos previos en los diferentes patrones gráficos de Criptomonedas.
✓ What is the Relative Strength Index - RSI and how is it calculated?
The relative strength index consists of a technical analysis that is responsible for predicting possible trends by examining anticipated action, noting their presence in crypto markets and also in traditional markets, it is important to know that they are an indispensable tool for traders. who seek success in their negotiations, having as a principle predicting the previous movements in the different graphic patterns of Cryptocurrencies.
Sus inicios en el año 1970 se mostró como una de las mejores herramientas para los corredores de bolsa ya que les permitiría analizar el trayecto del valor en tiempos específicos, en todo ese tiempo fue marcando la diferencia hasta que llegó el año 1978 dónde el ingeniero J Welles Wilder utilizo el oscilador de momento RSI para el traidig, lograron un gran éxito para luego ser reconocida, como una de las herramientas más confiables de análisis de patrones gráficos, en el mundo de las criptomonedas.
En conclusión es un análisis que sirve para saber técnicamente si los precio de una criptomoneda están sobrecomprado o en su defecto sobrevendido.
Its beginnings in the year 1970 proved to be one of the best tools for stock brokers since it would allow them to analyze the value path in specific times, in all that time it was making a difference until the year 1978 where the engineer J Welles Wilder used the RSI moment oscillator for the traidig, they achieved great success to later be recognized as one of the most reliable chart pattern analysis tools in the world of cryptocurrencies.
In conclusion, it is an analysis that serves to know technically if the price of a cryptocurrency is overbought or, failing that, is oversold.
Con respecto a la forma de calcular se puede decir que es muy compleja para los que estamos comenzando, pero lo cierto del caso es que si la estudiamos se nos facilitaran muchas cosas y estaremos a la espera de resultados.
Lo primero es comparar los últimos movimientos con sus diferentes variables de precio sumando las últimas variables de periodos en subidas y se divide con las últimas variables de periodos más bajas todo en valor absoluto parece sencillo, pero también hay que tomar en cuenta otro de sus aspectos que son sus parámetros en el cálculo es que su resultado de un valor de 0 a 100 teniendo un standard de 70 y 30 siendo los ideales para la sobreventa y la sobrecompra.
Regarding the way of calculating, it can be said that it is very complex for those of us who are starting, but the truth of the case is that if we study it, many things will be provided to us and we will be waiting for results.
The first thing is to compare the last movements with their different price variables, adding the last variables of periods in increases and dividing with the last variables of lower periods, everything in absolute value seems simple, but you also have to take into account another of its aspects What are its parameters in the calculation is that its result of a value of 0 to 100 having a standard of 70 and 30 being the ideal ones for oversold and overbought.
✓¿Podemos confiar en el RSI en el comercio de criptomonedas y por qué?
Su reputación durante más de 30 años y ventajas como, el poder ver en el mercado las diferentes áreas de sobrecompra y sobreventa, además su fácil manejo con su indicador técnico, la hacen una herramienta confiable donde todo depende de los diferentes usuarios, y aunque la aplicación es muy específica hay que aprender de sus métodos para que a la hora de confiar tu inversión estés en lo correcto, en pocas palabras si no sabes de zapatos no te metas a zapatero, para todo en la vida hay que prepararse y con el RSI no es la excepción, la confianza en el comerció va a depender del conocimiento que tengas en el mercado así que a estudiar bastante para tener éxito.
✓Can we trust the RSI in cryptocurrency trading and why?
Its reputation for more than 30 years and advantages such as being able to see in the market the different areas of overbought and oversold, in addition to its easy handling with its technical indicator, make it a reliable tool where everything depends on the different users, and although the The application is very specific, you have to learn from its methods so that when it comes to trusting your investment, you are correct, in a few words, if you don't know about shoes, don't go to the shoemaker, for everything in life you have to prepare and with the RSI It is not the exception, confidence in the trade will depend on the knowledge you have in the market, so study a lot to be successful.
✓¿Cómo se configura el indicador RSI en el gráfico y qué significa el parámetro de longitud?
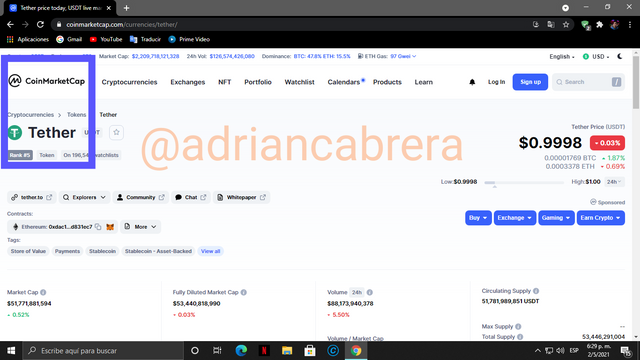
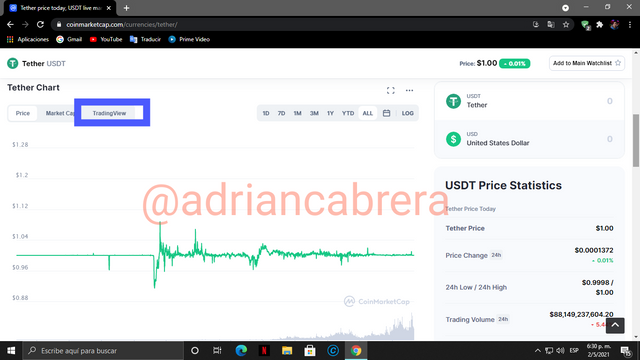
Para la configuración es una forma sencilla de realizarla solo debes entrar a una página de gráficos como Coin Market dónde seleccionas la criptomoneda de tu preferencia.
✓How is the RSI indicator set on the chart and what does the length parameter mean?
For the configuration it is a simple way to do it, you just have to enter a graphics page such as Coin Market where you select the cryptocurrency of your preference.
luego ubicas la pestaña que dice TraidigView
then you locate the tab that says TraidigView
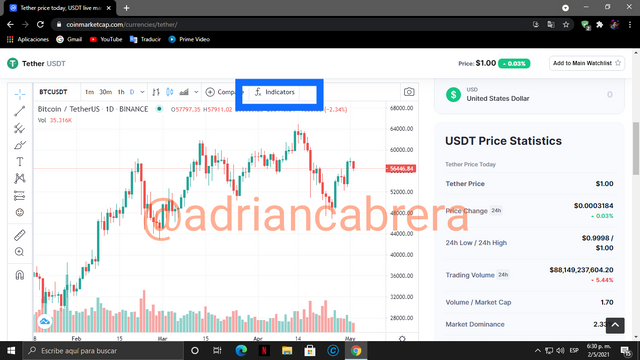
prosiguiendo con la pestaña que dice Fx indicator,
continuing with the tab that says Fx indicator,
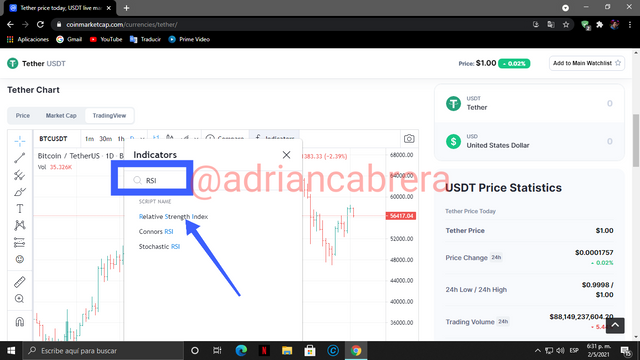
escribes RSI y seleccionas Relative strength Index
you write RSI and select Relative strength Index
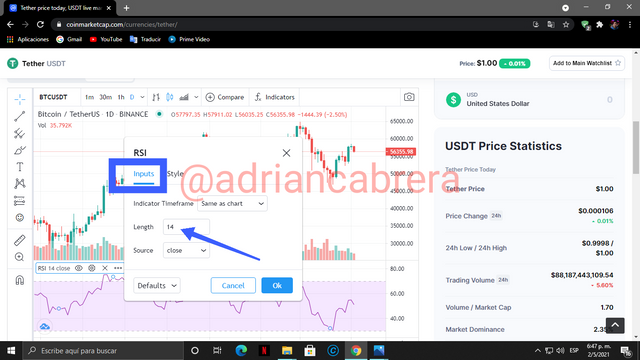
al desplegar está pantalla tendrás que buscar el botón de configuración
when displaying this screen you will have to look for the configuration button
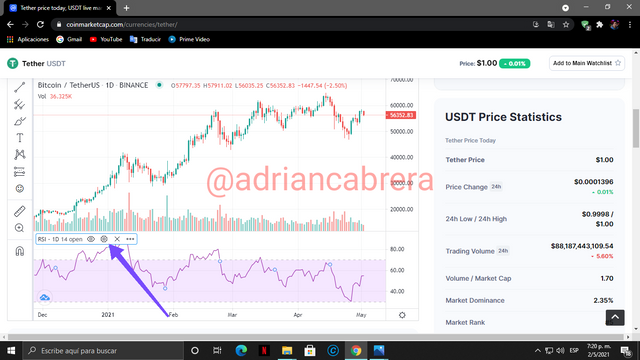
que te dará la opción de imput dónde podrás definir la longitud en 14 que es prácticamente la más más común, ya que establese los periodos de los diferentes cambios de precio de los activos y algunos otros valores importantes como tiempo etc
which will give you the option of input where you can define the length in 14 which is practically the most common, since it establishes the periods of the different changes in the price of the assets and some other important values such as time etc.
también tendrás la opción de Style para personalizar el gráfico,
you will also have the option of Style to customize the graphic,
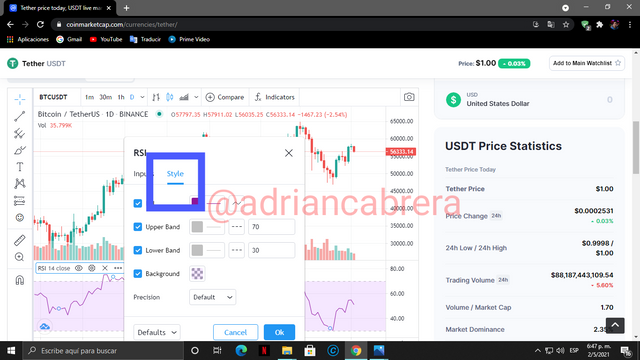
después de todo esto tendremos nuestro gráfico configurado a con el indicador RSI.
After all this we will have our chart configured with the RSI indicator.
✓¿Por qué es igual a 14 por defecto?
La razón de por qué es de 14 por defecto, es la siguiente, su período es considerado comúnmente para el cálculo del RSI igual a 14 esto equivale a 14 días, meses o años siendo la vía más efectiva para el traidig segun su creador Welles Wilder además permíte apreciar con mayor efectividad las diferentes tendencias en los activos.
¿Podemos cambiarlo?
Claro que se puede cambiar todo va a depender que buscas como comerciante y traidig, si las tendencias o picos altos o bajos para la compra y venta rápida.
✓ Why is it equal to 14 by default?
The reason why it is 14 by default, is the following, its period is commonly considered for the calculation of the RSI equal to 14 this is equivalent to 14 days, months or years being the most effective way for the traidig according to its creator Welles Wilder also allow you to more effectively appreciate the different trends in assets.
Can we change it?
Of course you can change everything will depend on what you are looking for as a trader and trader, whether trends or high or low peaks for quick buying and selling.
Se puede ver detalladamente sus indicaciones, para manejar las acciones futuras con calma es decir que tienes un lapso manejable.
You can see its indications in detail, to handle future actions calmly that is to say that you have a manageable period
Se refleja muchos picos que te obligan a actuar rápido a parte que no te garantiza que en tan poco tiempo sea más efectivo
Desde mi punto de vista un poco más complicado.
It reflects many peaks that force you to act quickly, apart from that it does not guarantee that in such a short time it will be more effective
From my point of view a little more complicated.
✓¿Cómo interpreta las señales de sobrecompra y sobreventa cuando opera con criptomonedas?
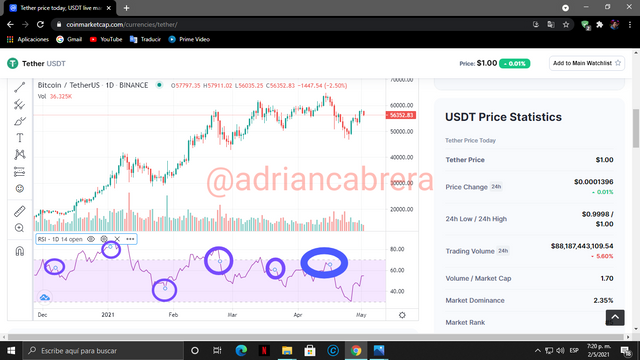
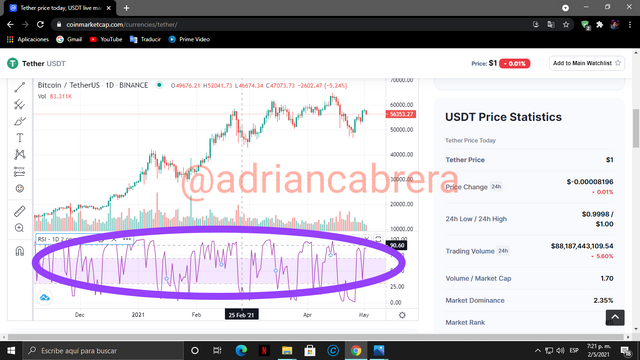
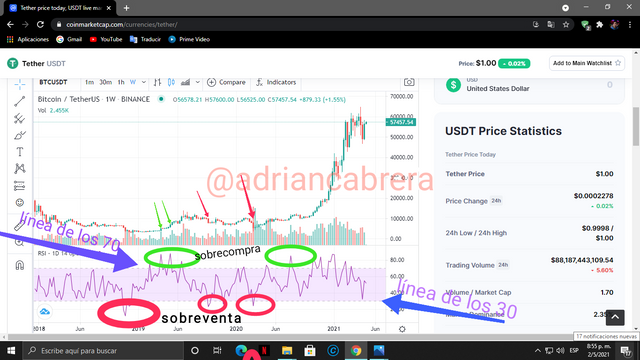
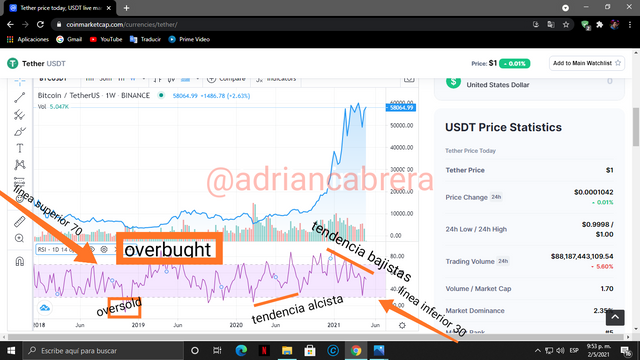
Lo primero que debemos saber es que el RSI se maneja por diferentes áreas la parte alta que es la que te indica que ha llegado el momento de la sobreventa y la parte de abajo que es la de sobrecompra, vamos a explicar en detalles, la sobreventa se manifiesta al momento de estar alrededor del nivel de 30 eso quiere decir que los precios han bajado y el movimiento pierde poder, ahora en el caso de la sobrecompra se manifiesta cuando está en el nivel de 70 y los precios van para arriba de manera repentina y lo más seguro es que de un momento a otro se vengan abajo.
Sencillo al estar debajo de 30 hay que comprar ya que el valor será por debajo de lo normal y al estar por arriba de 70 hay que vender ya que se supone que estaríamos obteniendo ganancias.
A continuación en capture explicaremos las líneas y las señales del RSI.
✓How do you interpret overbought and oversold signals when trading cryptocurrencies?
The first thing we should know is that the RSI is managed by different areas, the high part that is the one that tells you that the moment of overselling has arrived and the bottom part that is the overbought part, we are going to explain the oversold in details It manifests itself at the moment of being around the level of 30 that means that prices have fallen and the movement loses power, now in the case of overbought it manifests itself when it is at the level of 70 and prices go up suddenly and the safest thing is that from one moment to another they will collapse.
Simple to be below 30 you have to buy since the value will be below normal and to be above 70 you have to sell since we are supposed to be making a profit.
Next in capture we will explain the lines and signals of the RSI.
✓¿Cómo filtramos las señales RSI para distinguir y reconocer señales verdaderas de señales falsas?
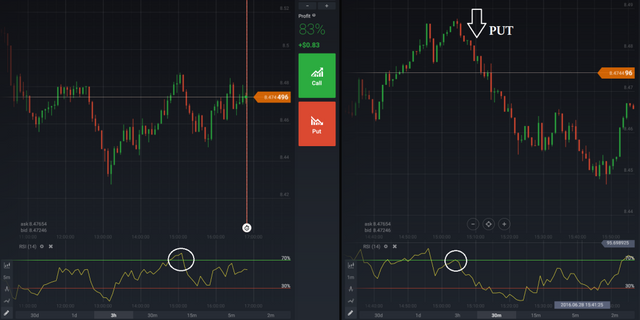
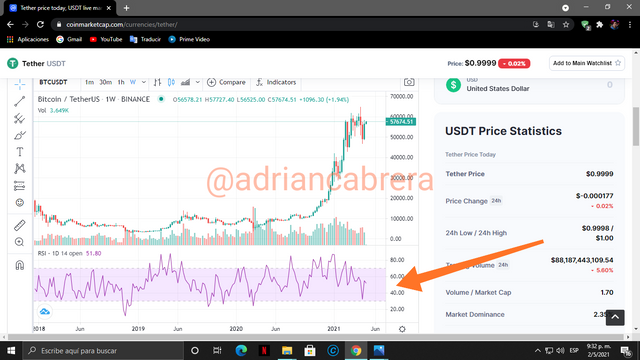
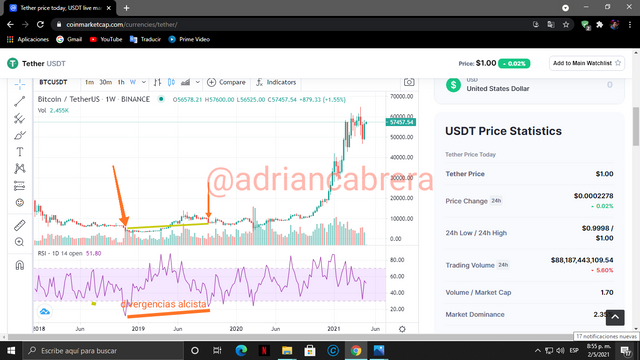
La forma de poder filtrar las señales es conociendo sobre las divergencias en las cuales se pueden presentar señales falsas tanto alcistas como bajistas y esto es producto a la falta de sincronización entre los precios o movimientos, como ejemplo les voy a presentar un capture donde se muestra la señal alcista pero realmente está por debajo de 30 y aunque vaya hacia arriba el gráfico del activó no refleja dicha alza.
✓How do we filter RSI signals to distinguish and recognize true signals from false signals?
The way to filter the signals is knowing about the divergences in which both bullish and bearish false signals can occur and this is due to the lack of synchronization between prices or movements, as an example I will present a capture where it is shown the bullish signal but it is really below 30 and although it goes up the chart of the activated does not reflect this rise.
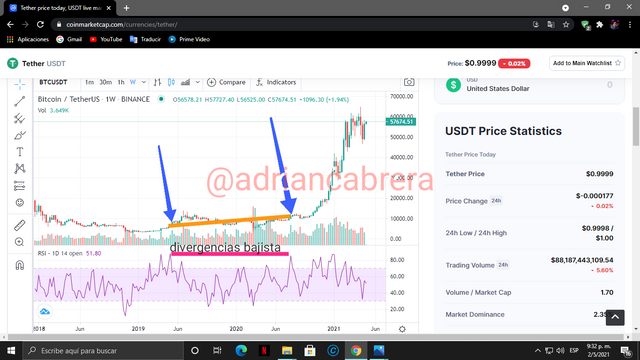
Ahora veamos la divergencias bajista
Now let's look at the bearish divergence
✓Revise el gráfico de cualquier par (por ejemplo, TRX / USD) y presente las diversas señales del RSI.
✓Check the chart of any pair (for example, TRX / USD) and present the various RSI signals.
✓ Conclusión:
Para finalizar podemos decir que la herramienta RSI es una fantástica alternativa y aunque no nos garantiza en 100 % la efectividad de nuestro movimiento se acerca a la realidad y es que sus aciertos importantes con algunas criptomonedas nos inspira confianza y como lo dije anteriormente solo hay que estudiar la herramienta para poder entender y sentirse seguro de lo que vas hacer.
✓ Conclusion:
Finally, we can say that the RSI tool is a fantastic alternative and although it does not guarantee us 100% the effectiveness of our movement, it is close to reality and that its important successes with some cryptocurrencies inspire us confidence and as I said before, we just have to study the tool to understand and feel confident about what you are going to do.
Agradecido por su atención y esperando ser evaluado me despido.
Grateful for your attention and waiting to be evaluated, I say goodbye
Los captures fuero tomados en la página
The captures were taken on the page
[Coin Market] (https://coinmarketcap.com/) and the Edits were made from my redmi 8 pro phone
Hello @adriancabrera,
Thank you for participating in the 4th Week Crypto Course in its second season and for your efforts to complete the suggested tasks, you deserve a 9/10 rating, according to the following scale:
My review :
Excellent article in form and content. You have succeeded by a large percentage in answering the questions. But the question:
Deserves more research to answer it and get the full score.
Thanks again for your effort, and we look forward to reading your next work.
Sincerely,@kouba01
Muchas gracias profesor seguire persistente en el trabajo de investigación.