Crypto Academy for Week 8 - Homework Post for @kouba01 | by @adenijiadeshina
BOLLINGER BAND INDICATOR
This is a a technical analysis tool used extensively in cryptocurrency trading. This particular indicator has been in existence for about three decades .This technical toll is available in many exchanges .
Now let us go deeper into this indicator.
This indicator just like other technical analysis tool gives prediction or signals based on happenings in previous trades and so , like other indicators , does not give a certain evaluation as nothing is certain in the cryptocurrency trading. As a matter of fact , the only thing that is constant is that the market must fluctuate.
This indicator has some major components ,or lines, which it uses to predict the behavior of coins.
The middle line( SMA) :This line takes the into consideration the previous closing price of the asset
Upper Curve = Middle line + Deviation Coefficient x Standard Deviation
Minimum (Lower Band) = Middle Line — Deviation Coefficient x Standard Deviation),
Square root (sum of the periods (closing price – SMA(closing price, calculation period)^2, calculation period / calculation period.
The length between the deviation of the upper band and that of the lower band equals the price of the asset.
The calculation period is dependent on the choice of the trader ; the more the calculation period , the more sessions is taken into consideration and the higher the accuracy of the indicator overall but the less sensitive it is in detecting price changes.
The period used to a great extent is dependent on the nature of trade in question; an intraday trader may settle for a small trade period whereas a trend trader may be looking at a larger period.The default period is usually 20.
READING OF THE BOLLINGER BAND INDICATOR
When all the Bollinger bands are arranged on a straight line, the market is stable ), and the increase of the of the asset takes. In this case, you can check from the rear to the top of the indicator,negleting the middle line, but this should be done only if the passage is tiny, there is a possibility of price movement to the opposite side, it is also important to work towards the direction that precedes this corridor, for example if the price Climbs to equilibrum, then it is corrected as soon as the corridor of action is created only from the lower band.
After the equilibrium, there is a high tendency for an uptrend and when the Bollinger bands are well separated, the asset goes on the bullish phase, with the bullish trend secured and the price above the Bollinger Bands mean position, the trend is healthy in the reverse case, the assets will experience a downtrend, and the asset price will be below the mean line.
Based on the chart bellow, it would be wise to go through the middle line, and often times, this is the end of the corrective trend at the ends of the Bollinger Bands, or when the price is away from the line. It is better to set positions at these points, but do not trade against the trends, and when the asset price is rising below the center line in an uptrend, this is a signal that the trend is approaching its end a new corridor (equilibrium) is about to be formed.
When analyzing using the Bollinger band, do not be of the opinion that is a certain prediction, for instance, if the price closes some points below the Bollinger middle line wait for a further confirmation , it is always ideal to not jump into it in a hurry and always set targets , like the support and resistance levels.
USING THE BOLLINGER BANDS INDICATOR ON A TRENDING MARKET
As the time interval reduces, the more the trade efficiency, if the limits is increased the unpredictability increases, and the wider the range , the narrower the indicator corridor and consequently the higher the price, so the asset price will break even after the exit.
Better still, the signal is processed in lower time intervals , and the trader tries to spot the signals when the asset price is free outside a tiny interval, although this is quite hard to achieve, because of the uncertainty and volatility of cryptocurrency trading.
In other to filter out false signals, it is advisable to use the support and resistance levels or signals, in that case evaluate the trends in this manner:
If a divergence occurs at the end of the narrow border, while the Bollinger band lines are moving, then the trend is valid.
If the price does not close surpassing or falling bellow the support or resistance level , the trend is incorrect and you do not need to start the trade or exit the current level, but it is useful to know that this technique only works if the market is trending; in a bullish or bearish trend.
THE BREAKOUT STRATEGY
Using this trading technique, we will start trading when the price breaks the upper or lower boundary of the Bollinger Bands, and also when the asset price limit is widened widen, which denotes increase uncertainty. Readings are even more accurate when combined with the the Volume Indicator for starting trades when asset volumes are currently increasing towards the breakout direction; To ensure a good price strength.
When all this standards are met, you can start a trade in the direction of the breakout trend. This is a technique that allows you to take the dividends of quick price fluctuations, resulting from increased trading volumes, and volatility. You have to stay in these types of trades until the asset breaks the moving average of the indicator in the reverse direction.
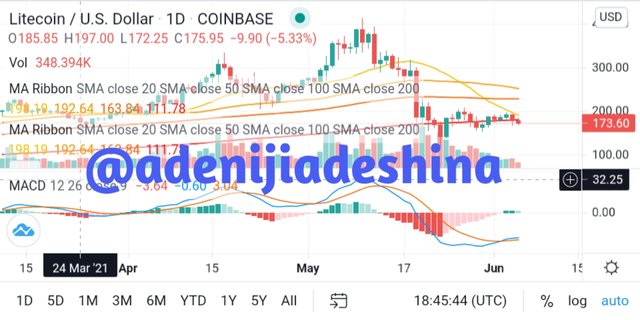
COMBINING THE BOLLINGER BAND INDICATOR WITH THE MACD INDICATOR
One good thing about technical indicators is that they can be used with other technical indicators . In this case I would like to combine the Bollinger band indicator with the MACD indicator .
What is the MACD indicator
Just like the Bollinger band indicator, this indicator analyses trade data such as previous highs and lows , closing price ,etc, to tell the current or future price movement or trends of the market. The MACD indicator consists of two EMAs( exponential moving averages ) ; the MACD line and the signal line and it tells future price behavior through the convergence and divergence of these lines and a histogram to show momentum.
So typically whenever the MACD line breaks above the signal line, the price rises and whenever it goes bellow the signal line , the price falls and a bearish trend expected , the combination of these two indicators allows for the Bollinger band showing the trends and the MACD showing the momentum .
FOR A BUY SIGNAL
The MACD line should be observed to be converging but hasn’t broken above the signal line.
Entry has to be when the market closes above the lower Bollinger band line.
FOR A SELL SIGNAL
When the momentum of the MACD line is reducing based on the histogram above the zero line.
Entry has to be when the trend closes beneath the upper Bollinger band line.
BEST TIMEFRAME FOR USING THE BOLLINGER BAND INDICATOR
Just like as been mentioned earlier, the best time interval is dependent on the needs and the trading strategy employed by the trader . An intraday trader and a day trader should use a smaller timeframe , 15 minutes or the hourly chart,because they seek to make profits from little price variations and a smaller time interval guarantees that but a swing or trend trader may opt for a bigger time frame , say one month or higher , because he or she is more interested in the overall efficiency and not small variations .
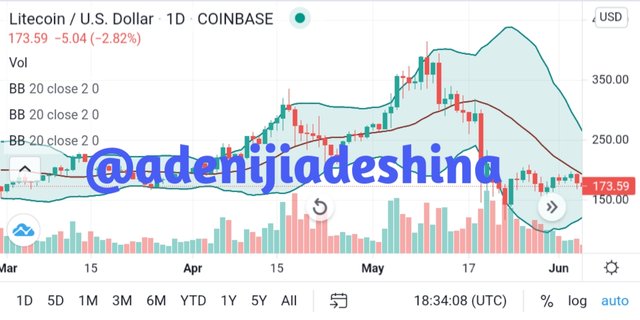
ANALYSIS OF LITECOIN USING THE BOLLINGER BAND INDICATOR

This coin is one that holds great promise , it has potentials to be a key player in the cryptocurrency market in the nearest future.
From the chart above, we can see that once the candle sticks close bellow the upper signal line, the price fell after, which is the reason while it is best to sell.
also when the candle close above the lower bollinger band signal, it means the price will increasemse soon so it is best to buy at this point.
Hello @adenijiadeshina,
Thank you for participating in the 8th Week Crypto Course in its second season and for your efforts to complete the suggested tasks, you deserve a 6/10 rating, according to the following scale:
My review :
An acceptable level article in which you tried to answer the questions clearly, but some points were lacking in-depth in the analysis, such as the last question, as we did not find any of the previously mentioned signals with the absence of follow-up of the pair's price movement.
Thanks again for your effort, and we look forward to reading your next work.
Sincerely,@kouba01