Understanding Trends II - Steemit Crypto Academy / S5W3- Homework Post for @reminiscence01
Hello Steemit
I am @adeelasif and here I am with my new homework post of Understanding Trends so here we discuss about without wasting time.

So here we go....

(A)
Explain Your Understanding Trend Reversal, What are the benefits of identifying reversal patterns in the Market?
As we know, there are usually 2 styles in the market:
- Bullish trend
- Bearish trend
Bullish or bearish trends do not always exist, so on the line, there is a Reversal to give the opposite effect. This reversal is called a Trend Reversal.
Different market trends, whether bullish or bearish, are determined by who is in control of the market. When buyers control the market, we see a bullish trend, and a bearish trend when traders control. As the trend continues, the incumbent team loses momentum in order to be able to drive prices where it is headed, and lose to the other team. This is how the reversal takes place.
A trend reversal may be a Bullish reversal to a bearish, when the bullish trend changes to a bearish trend or a bearish to bullish reversal, when we look at the bearish trend going backwards. In order to convert bullish to bearish, bulls are weakened and eventually defeated by bears that turn the market upside down. Similarly with the bearish trend to bullish, bears are losing control of price-raising bulls.
(B)
How can counterfeit signal retrieval in the market be avoided? (Screenshot required)
The patterns we use in predicting price movements are 100% accurate so care must be taken to avoid making trading decisions based on false signals. As we have learned from the lecture, we can identify a number of methods such as market downturns, trendline cuts, double-top and double-bottom designs and divergence to identify trend reversals. There are cases where we can see this pattern form, but there will be no retreat because this pattern reversal of the pattern was simply deceptive. In these cases, we need to not only rely on patterns, but we need to add technical indicators to confirm the merger or agreement before making any decision. I will use the RSI indicator in the chart below to explain this.
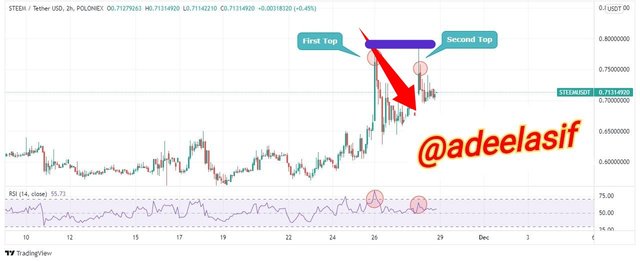
STEEMUSDT chart
As we know, the RSI uses 70 and 30 regions to indicate whether asset is being overused or not. Excessively purchased goods are expected to be deferred and excessively sold goods are expected to be impaired. In the screenshot above, we see a duplicate form of top structure on the STEEMUSDT chart, which shows the reversal. However, this modification is invalid. Let me explain with a example.
We note that after the construction of the first top of structure, the RSI broke more than 70 indicating that STEEM was overused and, indeed, STEEM was delayed in reversal. However, after the formation of the second top, the RSI does not show excessive trading, suggesting that there will be no reversal of the trend.
Provide a detailed description of the Reversal Trend identification and make a backup copy of your description using the original chart, Do this for both bullish and bearish trends?
(Screenshots required)
So here I am going to describe about the following.
a) Break of market structure
b) Break of Trendline
c) Divergence
d) Double top and Double bottom
a) Break of market structure
We have discussed how the market structure can be used as an indicator of trend continuity. With this information, we can say that a break or a break in the bullish or bearish market structure indicates that the market is preparing for a possible recession.
In a bullish trend, the market structure reflects the price making the price higher and lower. This means that the value should make it higher than the first and lower and lower than the previous low. This will show that the bulls are still in control and moving the market forward. Failure to make new heights is a breach of the bullish market structure and will indicate the strength of bulls is declining and bears are beginning to dominate the market. Let’s take a look at the market structure break in the bullish trend below, building on the bullish to bearish transition.
ETHUSDT chart
In the ETHUSDT 1 hour chart above, the price cannot be significantly lower. Also, the lower end of the building extends beyond the end of the arrow, which is the lower point of the previous one. In a bullish market structure, the new low cannot be lower than the previous low. Thus, the continuation pattern is broken and the trend downward trend occurs.
With a bearish trend, the market structure reflects the price making the price higher and lower. The price should make the height lower than before and lower down than before. This is an indication that bears are controlling the market and driving prices are low and low. Failure to make highs and lows is a violation of the cheap market structure and indicates that the bear is losing control of the market due to bulls. Let’s take a look at the bearish market structure break below that leads to a bullish reversal.
SHIBUSDT chart
Price cannot be displayed in the SHIBUSDT 1 hour chart above. The bearish market structure is broken when the price makes it much lower than the previous low. This indicates that the bulls are now in control of the market and that there will be a backlash.

b) Trend line break
And in our previous lessons, we learned how to use trends to determine trend continuity. Since we have 2 trends. The bullish line is drawn under the price movement that connects the two lower points that act as a support. To find a bearish trendline, the trendline is drawn above the price movement, which connects 2 high points that act as a resistance. The price jump for these trend lines, but if it breaks the bullish trendline support or bearish resistance resistance, a retreat to the other side is imminent. Let’s take a look at the trend setback due to a break in the trend line below.
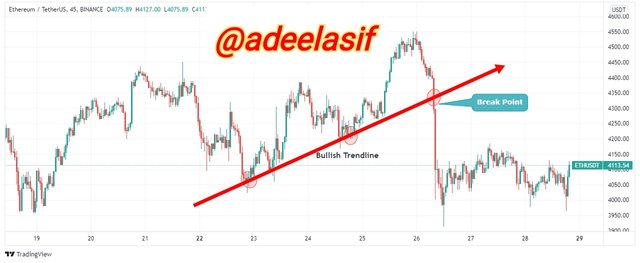
ETHUSDT chart
The value breaks the bullish line in the ETHUSDT chart for the 45 minutes above, looking to move backwards. The bullish Trendline is a volatile support under price movement, rising prices, and going below this line raises the potential for a slowdown in trend. The chart above fluctuates bearish.
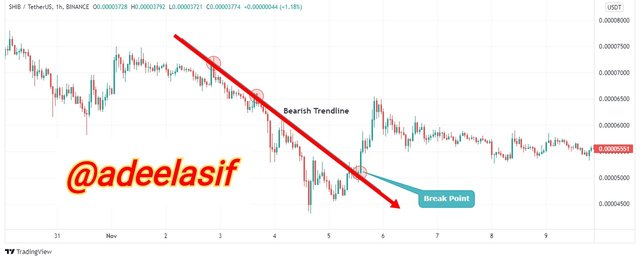
SHIBUSDT chart
In the SHIBUSDT 1 hour chart above, the price breaks the bearish line, rising. The bearish trendline is portrayed as a volatile resistance over price movements, rising prices, and volatility exacerbating the imminent trend of reversal trend. The chart above is a bearish to bullish reversal.
c) Divergence
Divergence can be understood as inconsistencies or lack of coherence between price movements and technical indicators. In the event of a split, the price and technical index moves in the opposite direction, contradictory. For example, the price may make a high rise indicating bullish movement, and without this fact, the technical index may cause a lower downward trend. Here we discuss about two types of divergence :
- bullish divergence
- bearish divergence
Bullish Divergence
During the bullish breakdown, the price caused a sharp decline while our technical index contradicts the price movement which causes a high upward trend indicating that trading pressure is declining and there is pressure to buy as the bulls try to control the market. This shows traders that it is possible for them to be pushed back in time to enter the mall to buy goods at a lower price and sell at a profit if the reversal occurs.
ETHUSDT chart
In the XRPUSDT chart of 4 hours above, we see a discrepancy between price movements and RSI, as RSI makes a high decline while a price makes a low decline. This indicates a lack of coherence, which suggests that there is a slowdown in trend. We actually see this happen, shortly after the divergence.
Bearish Divergence
Here, the price seems to be going up a uptrend making it higher and higher, but our index is making lower prices which indicates that the buying pressure is decreasing and the sales pressure is increasing as the bears try to control the market. This means that there is a near-term decline and traders are using this signal to make a profit out of the start of the downtrend, and to devise strategies to take advantage of the downtrend.
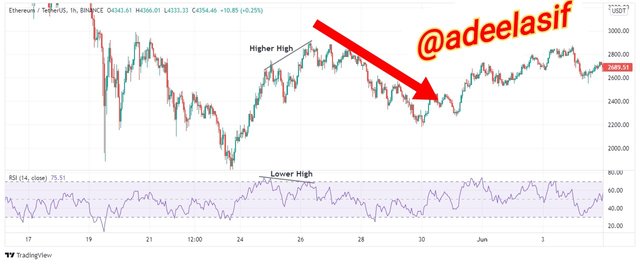
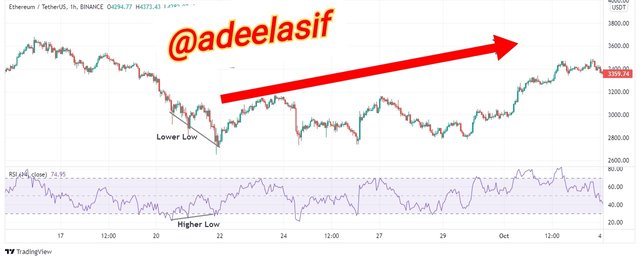
ETHUSDT chart
In the 1 hour 1 ETHUSDT chart above, there is a discrepancy between the price movement and the RSI, as the RSI makes a low rise while the price makes this high. This indicates a weakening of buy pressure and construction trading pressure suggesting that the bears are taking over the market and that a bullish to bearish reversal is imminent.
d) Double Top and Double Bottom
The structure of the market teaches us that the price needs to make a high up for the bullish trend to continue to be acceptable, as well as for the lower to continue with the bearish trend to be acceptable. When double up and double down, the price cannot create new heights or lower. Double-top design and double down because the price makes the original price higher or lower, making attempts to get it back but fail.
- Double Top
Double Top buildings occur in trends. In a double-digit building, the price makes a rise and after a reversal, it tries to make it higher than the previous one but fails. This breaks the market structure into a bullish trend, and is a major sign of a near-downward slowdown. Double-digit signals consumers are not able to create enough buy pressure, and they lose momentum to traders. As a strong bullish signal to a bearish reversal it also allows traders to shorten their assets at a profit before a negative recession.
The value should not be broken above the previous high point as this would mean that there is a continuation of the bullish trend, and it makes the high double formation ineffective. Also, the closing price of the second floor must not be higher than the first upper point so that the double upper structure is valid.
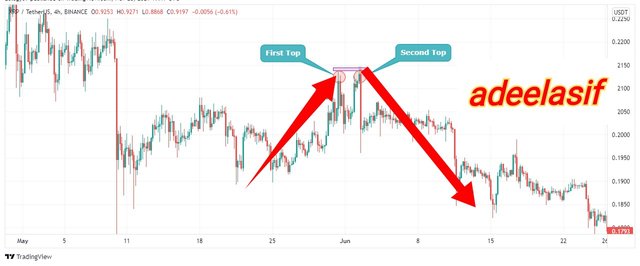
XRPUSDT chart
In the XRPUSDT 4-hour chart above, we see a duplicate form of top structure. This occurs when the price creates a first upper, and in an attempt to reach or break above the top a second is formed, which can break the previous top. It is a strong bullish to bearish signal to retreat as bulls can push the price because there is not enough pressure to buy.
- Double Bottom
At Double Bottom, the bearish trend structure is broken as the price is lower and in an attempt to break it, it fails. This shows that bears are losing control of the bull market as they are unable to create enough trading pressure to keep pushing the price to make a new downturn. It is a strong bearish to bullish trend change, which allows traders to enter long-term cheap positions and sell when the expected upward reversal comes.
The price should not break below the previous low point as this would mean that there is a continuation of the bearish trend, and it makes the dual low double formation ineffective. Also, the closing price of the second floor should not be lower than the lower floor of the first floor so that a double floor structure is allowed.
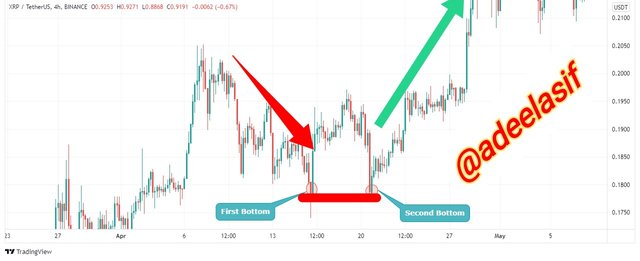
XRPUSDT chart
In the XRPUSDT chart above, the price movement creates the first low, and attempts to create a lower bottom, but fails to do so, producing a second low and not as low as the first low. This means that the bears are not able to create enough sales pressure to continue lowering the price and conversion will take place.
Place a demo trading using any crypto trading platform and enter a buy or sell platform using any of the above reversal patterns?
Demo trading using Trendline Break
SANDUSDT chart
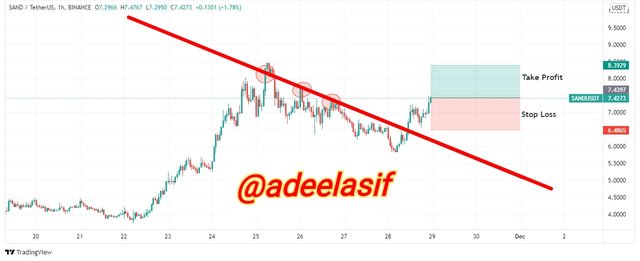
From the SANDUSDT 1 hour chart above, we see that the trend line is broken and a trend change is detected early. The price has not been able to drop and make a higher rise, suggesting that bulls are taking the market, which is why a bearish to bullish shift has taken place.
After playing a trendline break indicating a bearish to bullish reversal, I enter a long distance with a loss of standing at 6.4867 just below the recently broken support level. I set my take profit from 8.3929 to 1: 1 R: R with my stop loss. Below is my proof of transaction.
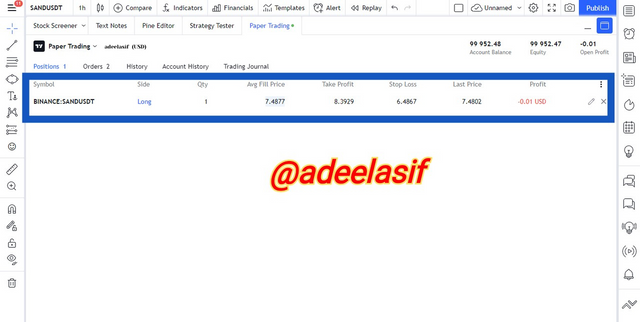
SANDUSDT Proof of Purchase
Conclusion
Just as it is important to learn to identify trend continuity patterns, it is equally important to learn to identify trend reversal patterns. In fact it is very easy because we know that if the continuous pattern is invalid, it causes a reversal. We can identify trend declines in the following ways: market structure break, trend line break, divergence, double top and double bottom structure.
Cc:-
Prof : @reminiscence01
Author:-

Sir your post is very beautiful i love it
Thank You Sir