Steemit Crypto Academy / Season 4 Week 2 - Homework Post for @reminiscence01 | Technical Indicators.
Thank you professor @reminiscence01 for this week's session. It was a pleasure being a part of the class. Below is my homework post.

Introduction
1a) Explain Technical Indicator And why it is a good Analysis Tool
Technical indicator is a graphic representation of past data such as demand, price and trading volume in order to determine what will probably happen in the future. Technical indicators are of various types and categories as it would be discussed later. They enable a trader to study how a market moved a day ago, a month ago, a year ago, etc, and to use such information to predict what will likely happen in that market in the coming week, month, year, etc. It is clear that this way, technical indicators are not absolutely certain, rather, they are probabilistic in nature.
Uses of technical indicators
There are various reasons why traders use technical indicators. Some of them are; to predict the future of a trading pair, to make decisions on when to enter and exit the market, to set trading guides such as stoploss, support, resistance, etc. In addition, technical indicators serve as a signal confirmation for other tools of used in technical analysis.
Why Technical Indicators are good analysis tools
Technical indicators are a good analysis tool. There are many reasons to back this up. Looking at some of it's uses above, Technical indicators back major decisions of a trader. The signals gotten by a trader will help in determining whether or not to start a trade. Also, trading guides will help reduce losses and enhance profit making which is the reason for trading. Also, by confirming other signals received from other analysis, one can be sure of the next step to take.
In summary, a trader who understands market movements will gain more with technical indicators set in motion.
1b) Are technical indicators good for cryptocurrency analysis? Explain your answer.
Technical indicators are good for Cryptocurrency analysis. A trader who sets technical indicators in motion and study them vividly will know when to initiate a buy order and when to place a sell order. Once buying and selling is done at the right time, trading will be successful. A cryptocurrency trader who knows whether the market is ranging or trending will know when to make a move. Such trader can only have these knowledge with the use of technical indicators. Also, since technical indicators involves the use of past data to predict the future, a trader can easily look at demand to predict if the prices will swing up or down as high demand pushes up price and low demand pulls it downwards.
1C) Steps to add technical indicators to a chart and how to configure it
Step 1: Log in to the tradingview website.

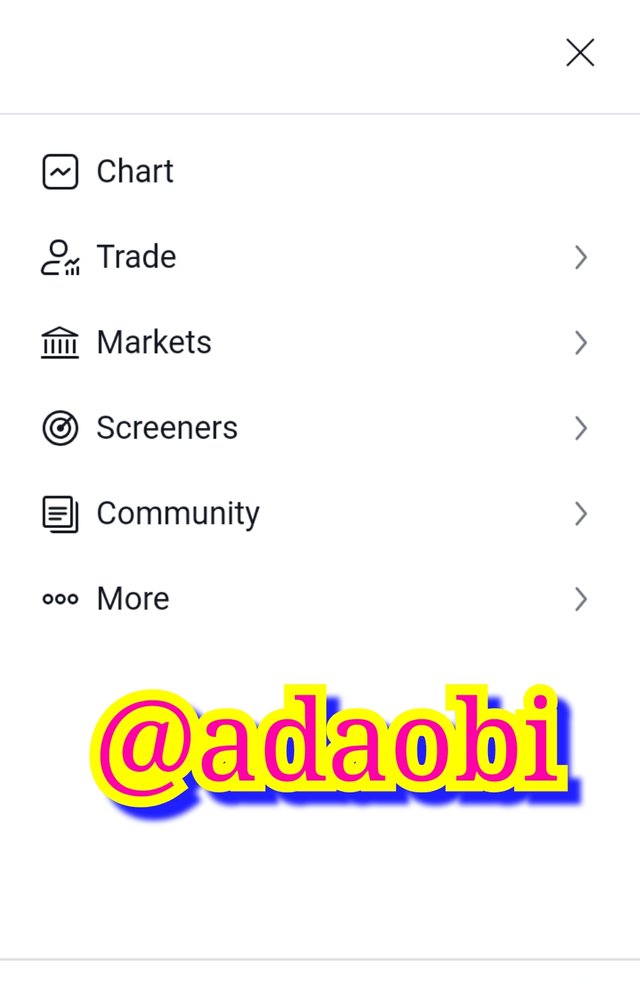
Step 2: Click on menu button and then click on charts.
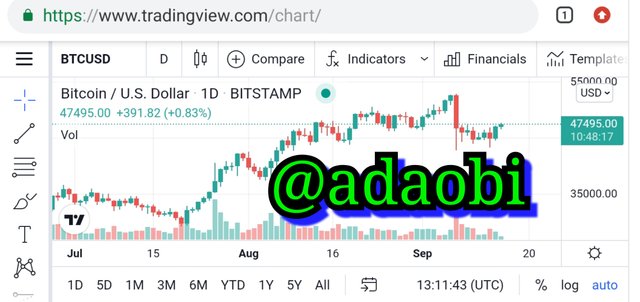
Step 3: Select a cryptocurrency pair that will appear on the chart. I chose BTC/USD.
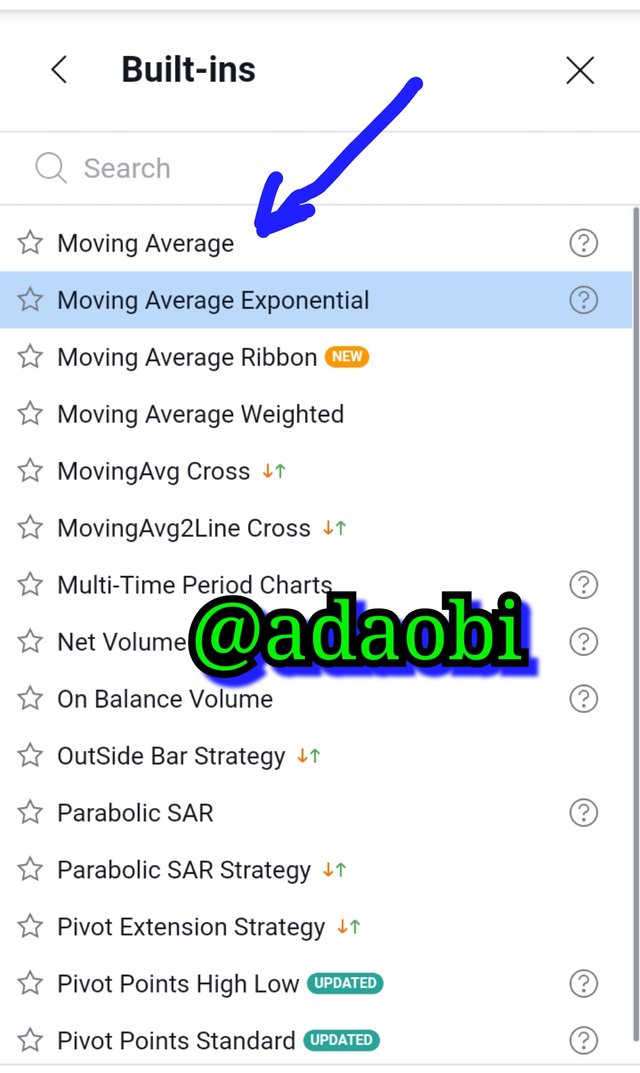
Step 4: Click on indicators on top and select built-in.
Step 5: click on any indicator of your choice. (I chose the Moving average indicator).
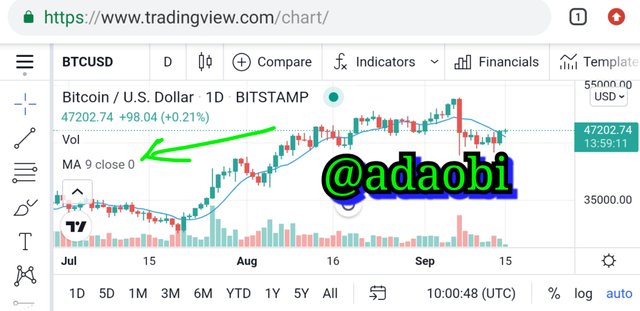
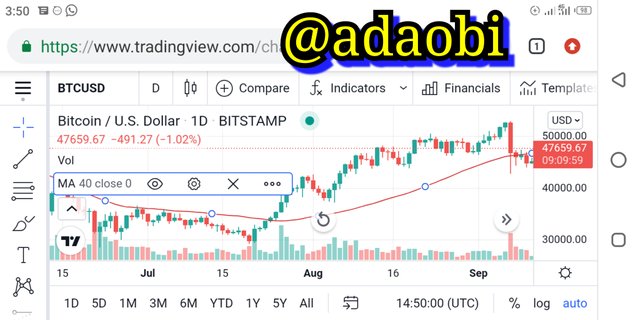
Step 6: Close the tap and the indicator would be added to your chart.
To configure it,
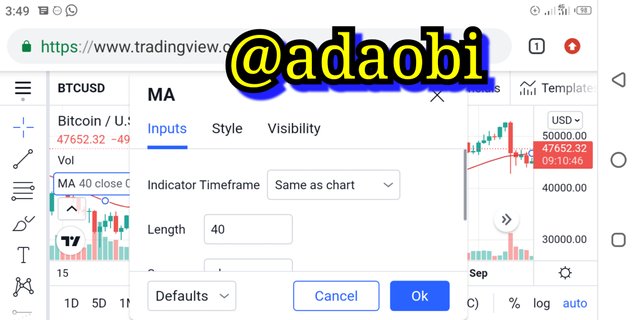
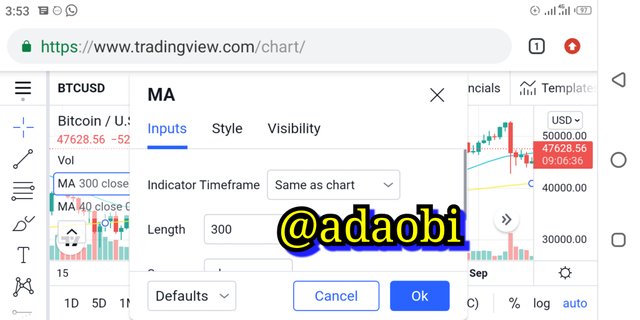
Step 1: Double tap on the indicator on your chart.
Step 2: Click on input to select the length. (I set my own to 40).
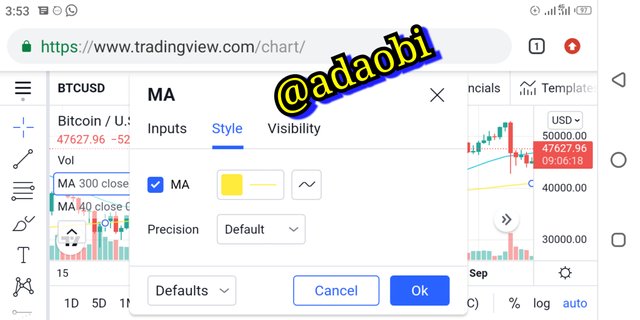
Step 3: Click on style to change the color. ( I chose red).
Step 4: Close the tap and your indicator would be successfully configured.
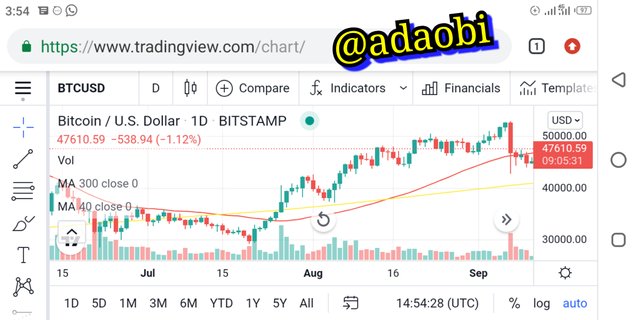
I also did it for long where I set the length to 300 and the color to yellow. They are shown in my chart below.
2A) Categories of Technical Indicators
There are various categories of technical indicators and this is based on the various functions and the signals they send.
1. Momentum / oscillator indicator: As the name implies, momentum indicator shows the movement of prices from one point to another. Prices could move upward at point A and reverse at point B. With oscillator indicator in place, a trader would be given a corresponding signal with these movements.
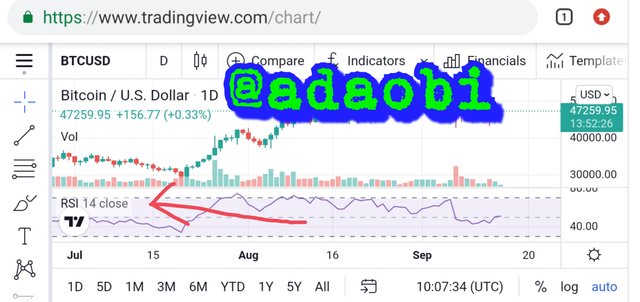
An example of momentum indicator is the Relative strength index (RSI). Relative strength index indicator is one of the most used indicators that help a trader decide his/her entry position. It indicates oversold and overbought. RSI is bound at an index of 0 to 100 and traders who use RSI consider overbought when RSI is over 70 while oversold is spotted at a level lower than 30.
2. Support and Resistance Indicator:
This is an indicator that places a higher and lower price limit for a trading pair. In other words, support and resistance are barriers to price movements either upward or downward. Once prices touch the support or resistance, it is expected that there would be a reversal. An example of Support and resistance indicator is the Donchain channels (DC).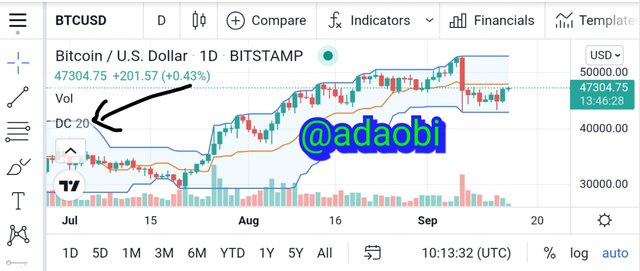
3. Volatility Indicators:
These indicators measure the frequency of price changes in a market. Some cryptocurrency pair are more volatile than others. This means that prices of the volatile coins change more often than the less volatile market. Having an idea of how frequently prices would change will help the trader to trade cautiously. An example of volatility indicator is Bollinger band.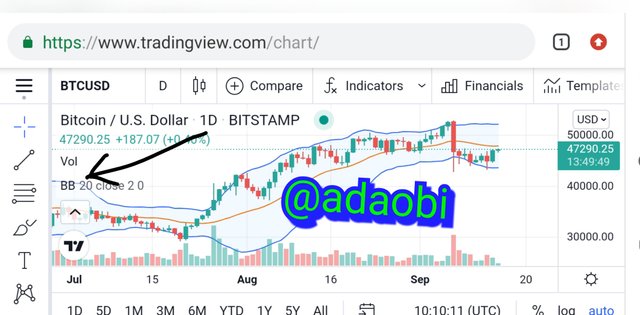
4. Trend indicators:
Trend indicators help identify a weak and strong market movement. A weak trend signifies a weak market movement and vice versa. Also, a trend indicator also identifies whether the market is in a trending or ranging direction. The trend goes a long way in helping a trader make good choices of investment. A good example of a trend indicator is the moving average and ADX. Moving average shows an average price of a cryptocurrency pair over time.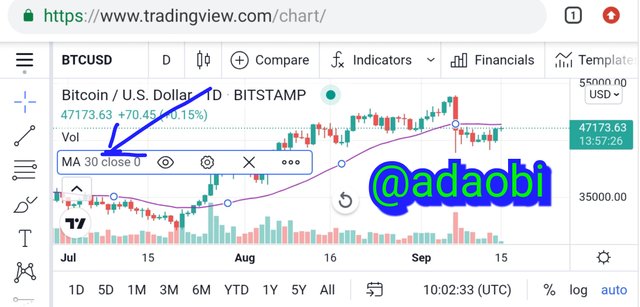
2B) Briefly explain the reason why indicators are not advisable to be used as a standalone tool for technical analysis.
Technical Indicators are better when they are used alongside other technical analysis tools. This way, they will work as signal confirmation for other signals received from those other tools. Hence, they are not really fit to be used as standalone tool of analysis. This is because they represent past data and there is a likelihood that a market will not move in the direction it moved in the past. They are not absolutely correct. Depending on its signals alone may be misleading, therefore causing a trader to make the wrong moves. However, when combined with other technical analysis, there is a reasonable degree of certainty derived from those signals.
> 2c) Explain how an investor can increase the success rate of a technical indicator signal.
There are various ways in which an investor can improve the success rate of indicator signals.
1. Timing: An investor who monitor and time the chart will get a timely signal and work in accordance with that signal. This will make the analysis effective.
2. Understanding the way indicator works before usage: An investor who studies the way an indicator works will know how to interpret the signals gotten. This will also make such analysis successful.
3. Combination of two or more indicators: The success rate of indicator signals can also be enhanced if the trader uses more than one indicator. In a case where one fails or produce faulty signals, others can be more accurate.
4. A trader can also set an indicator in motion without any trading activity, just to study how accurate an indicator would be to determine if he/she can use such indicator.
Conclusion
Technical indicators are inarguably important in any trading activity. Once an indicator works accurately and efficiently, a trader will enjoy more profit and losses would be reduced to the barest minimum. This is why it is important for a trader to understand each category of technical indicator in order to select the ones he will understand better. Combining each of them in a chart will work better for the trader.
Thank you so much for your time.