Trading Crypto with On-Balance Volume Indicator - Crypto Academy / S5W4 - Homework Post for @fredquantum
Hello Everyone,
I'm starting the 4th week of the 5th season of Crypto Academy with this post. In this post, there are assignments in this week's lecture by professor @fredquantum. The subject of this sharing will be about ”On-Balance Volume (OBV) Indicator ”, I would like to start my sharing without further ado.
Let's start!

Question 1
In your own words, explain your understanding of On-Balance Volume (OBV) Indicator.
On – Balance Volume (OBV) Indicator
The most basic definition of On – Balance Volume (OBV) Indicator: It is a momentum-based Breadth indicator that traders, namely us, use to measure buying and selling pressure. This indicator is drawn by evaluating the changes on the price and the changes on the volume together.
Breadth Indicators: They are powerful technical analysis tools that help us identify ups, downs or sideways movement in the market.
The OBV indicator was developed by a financial writer, Joe Granville, with the full name “Joseph Ensign Granville” and was first introduced by Joe Granville in 1963 in his book “New Key to Stock Market Profits”. The OBV indicator is also very important in history, because the OBV indicator is among the first indicators in history to explain both positive and negative flow.
According to Granville, the key force behind the market was volume. For this reason, it has designed the OBV to project at the time of the big moves in the markets depending on the volume changes in the market. He even describes the predictions produced by OBV as "a tightly coiled spring" in his book. Again, in Granville's point of view: If volume increases sharply when there is no significant change in prices, it indicates that prices will eventually go up or down.
Today, the meaning and use of the OBV indicator has not changed, and it can easily be integrated into the Cryptocurrency market. The OBV indicator provides us with many conveniences during our trades. Thanks to the OBV indicator, we can interpret and predict the future movements of the price based on the buying and selling pressure.
When using the OBV indicator, there are benefits and points that we should pay attention to:
- As we said before, the OBV indicator is an indicator that explains positive and negative flows. It measures the buy and sell volumes over time, adding volumes on positive days and subtracting volumes on negative days. This allows traders to easily predict the movement of the asset's price in both directions.
- The OBV indicator is also used to identify bullish/Bearish breakouts on the market.
- The OBV indicator generally moves the same as the price and allows us to confirm the ups/downs on the price.
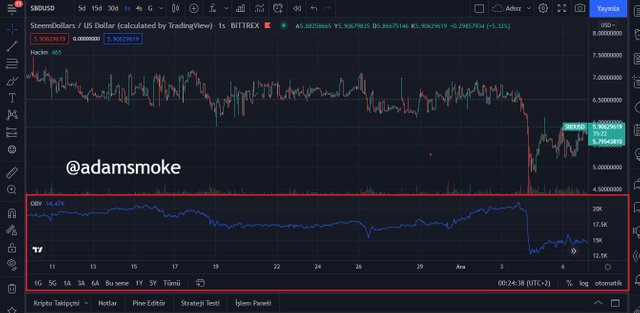
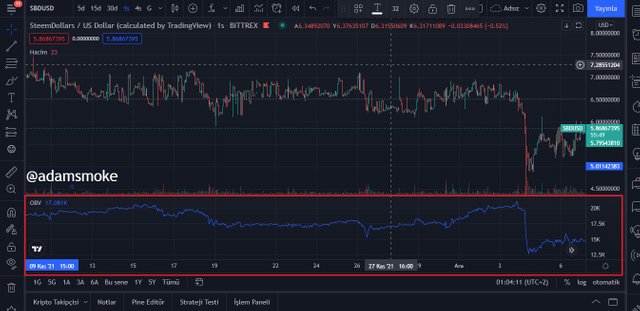
As a result, the OBV indicator is an indicator that is easy to understand and interpret. It can also be used very easily by traders who are new to trading. The view on the chart is located just below the price chart, as you can see in the screenshot below.
Question 2
Using any charting platform of choice, add On-Balance Volume on the crypto chart. (Screenshots required).
In this section, I will show you how to add an OBV indicator via the Tradingview platform.
Steps:
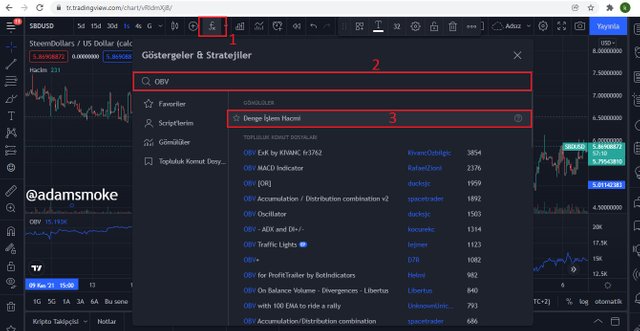
- First we open the graph of any pair, then click on the “Indicators (Fx)” icon at the top of the page as you can see in the screenshot.
- Then a drop-down menu appears. In this menu, we write “OBV” in the search section and click on it to add the indicator to our chart.
Question 3
What are the Formulas and Rules for calculating On-Balance Indicator? Give an illustrative example.
When using the OBV indicator, we do not need to do any mathematical calculations, the indicator does it automatically for us. However, in order to fully understand what the indicator is, we need to know what the underlying mathematical calculation is and what values are used. This helps us to better understand and interpret the indicator while using it.
Three rules emerge when calculating the OBV indicator. These:
- If the closing price of the current period is higher than the closing price of the previous period;
OBV = Previous Period OBV + Current Period Volume
- If the closing price of the current period is lower than the closing price of the previous period;
OBV = Previous Period OBV – Current Period Volume
- If the closing price of the current period is equal to the closing price of the previous period;
OBV = Previous period OBV
Now let's show this calculation with a 5-day example.
- 1. Day: Closing Price = $15, Volume = 40,000
- 2. Day: Closing Price = $25, Volume = 50,000
- 3. Day: Closing Price = $20, Volume = 45,000
- 4. Day: Closing Price = $25, Volume = 45,000
- 5. Day: Closing Price = $25, Volume = 30,000
Now let's calculate the OBV value according to the above data:
- 1. Days OBV = 0
- 2. Days OBV = 0 + 50,000 = 50,000
- 3. Days OBV = 50,000 – 45,000 = 5,000
- 4. Days OBV = 5,000 + 45,000 = 50,000
- 5. Days OBV = 50,000
As we can see in the above transactions: We added the volume because the closing price on Day 2 and Day 4 was higher than the closing price of the previous day. Then, when we look at the 3rd day, we subtracted the volume because the closing price was lower than the closing price of the previous day. Then we said that since the closing price on Days 4 and 5 are equal, the OBV on Day 5 is equal to the OBV on Day 4.
Quesiton 4
What is Trend Confirmation using On-Balance Volume Indicator? Show it on the crypto charts in both bullish and bearish directions. (Screenshots required).
In order for a trader to make an accurate trade, he must know the trend on the market correctly. Because we generally move the direction of our trade in the direction of trends. In this section, too, we will learn how to confirm Trends with the OBV indicator.
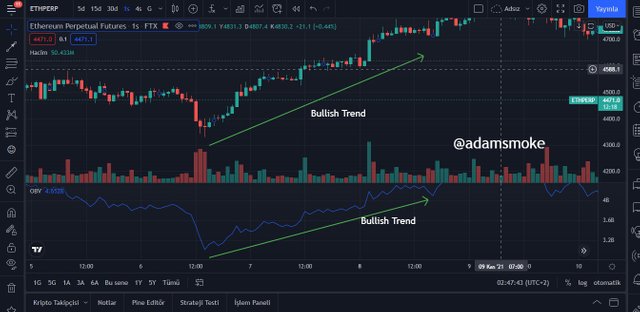
When there is a Trend over the market, we see the OBV line forming a succession of higher highs and higher lows. This pattern shows us that the market is moving upwards and the trend is a Bullish Trend. We can clearly see this in the screenshot below.
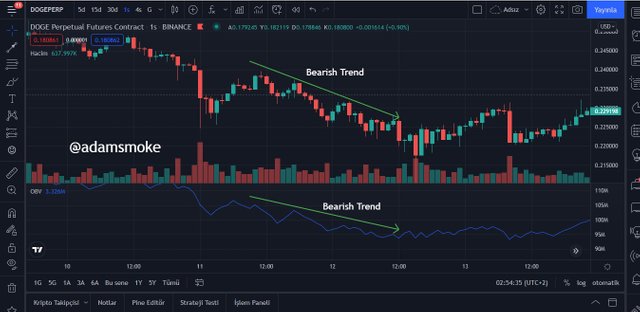
When there is a Trend on the market, we see the OBV line forming a succession of Lower lows and Lower highs. This pattern shows us that the market is moving down and the trend is a Bearish Trend. We can clearly see this in the screenshot below.
Quesiton 5
What's your understanding of Breakout Confirmation with On-Balance Volume Indicator? Show it on crypto charts, both bullish and bearish breakouts (Screenshots required).
Breakouts on the market usually happen after the market has consolidated (when there is no trend, sideways movement, etc.). There is no particular trend on the market in this time period and it is called the waiting (accumulation) phase for a new trend. After this phase is over, we call it “Breakout” when a sudden rise/fall on the price occurs and the price jumps from the points we have determined as support or resistance.
Since one of the elements of the OBV indicator is trading volume, it is possible to confirm Breakout points on the market. In this way, we can determine our own entry and exit points during our trade.
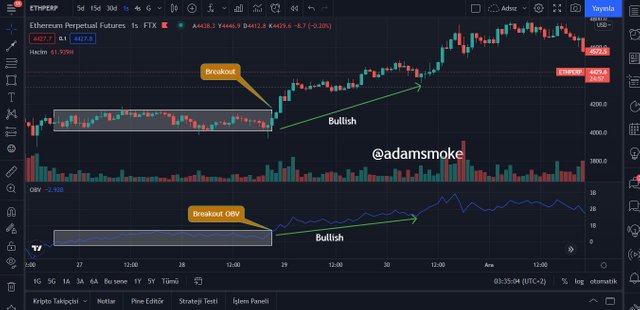
As we can see in the screenshot above, the price consolidates for a certain period of time and moves between certain support/resistance points. Then we see that the price action is also supported by our OBV indicator. After a while, we see that the price has broken our resistance point and when we look at the OBV indicator, we confirm this breakout. This breakout is on the upside and gives us a buy signal. We can call it Bullish Breakout.
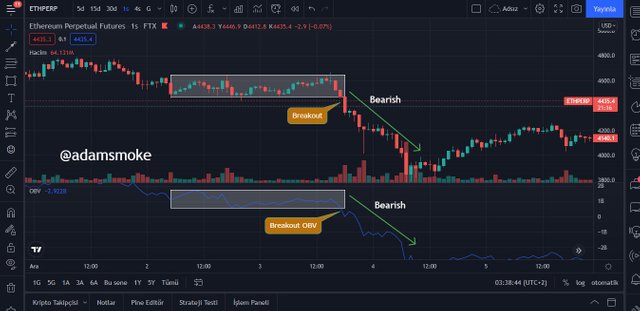
As we can see in the screenshot above, the price consolidates for a certain period of time and moves between certain support/resistance points. Then we see that the price action is supported by our OBV indicator. After a while, we see that the price has broken our support point and when we look at the OBV indicator, we confirm this breaout. This breakout is on the downside and gives us a sell signal. We can call it the Bearish Breakout.
In short, breakouts in the OBV indicator give investors buy or sell signals. In this way, investors can direct their trades and choose the position they will take correctly.
Quesiton 6
Explain Advanced Breakout with On-Balance Volume Indicator. Show it on crypto charts for both bullish and bearish. (Screenshots required).
In the previous section, we saw the Breakout confirmation with our OBV indicator. Now we will see how the Advanced Breakout approval is done with our OBV indicator. We know that after a while in a consolidated market, the price breaks out either up or down. Advanced Breakout: It is the break that occurs when the price of an asset fails to break the previous high/low, but the OBV indicator breaks the previous high/low. This also shows us the presence of volume injected on the asset in a certain direction and indicates that its price will rise above the previous high/low.
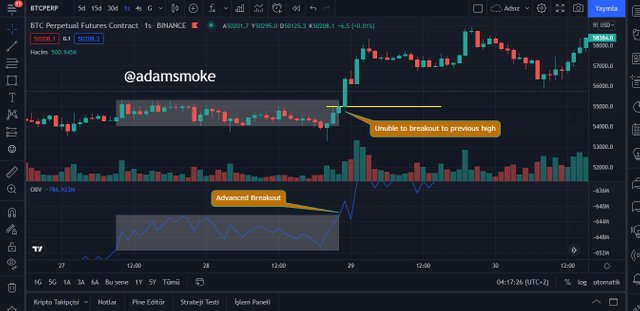
As we can see in the screenshot above, our OBV indicator is breaking the previous high while the price is unable to break the previous high. This tells us it's a bullish advanced breakout. This also gives us the news of a strong uptrend. After looking at our chart, we can see that there is a strong rise.
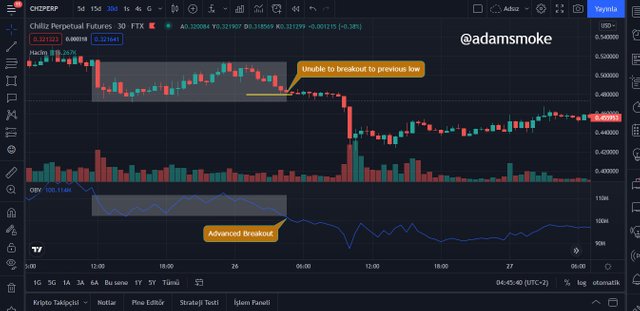
Likewise, as we can see in the screenshot above, our OBV indicator is breaking the previous low while the price is unable to break the previous low. This tells us it's a Bearish advanced breakout. This also gives us the news of a strong decline. When we look at our chart afterwards, we can see that there has been a strong decline.
Question 7
Explain Bullish Divergence and Bearish Divergence with On-Balance Volume Indicator. Show both on charts. (Screenshots required).
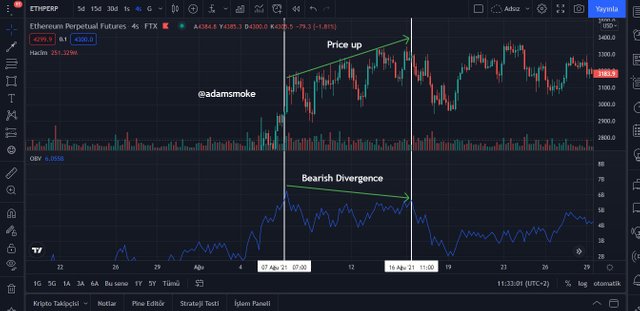
With the OBV indicator, it is possible to predict trend reversals and trend exhaustions using price movements. Let's say the price is in an uptrend, as the price moves higher and higher, the OBV indicator can accompany this movement with lower volumes. This tells us that the uptrend has been exhausted and that the trend will reverse and a downtrend will begin. This condition is called “Bearish Divergence”.
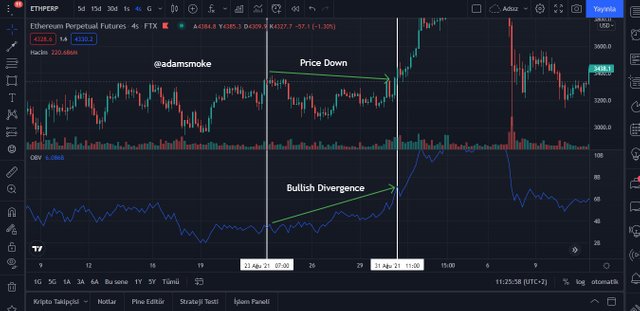
Likewise, let's assume that the price is in a downtrend, as the price moves to lower and lower levels, the OBV indicator may accompany this movement with higher volumes. This tells us that a downtrend has been exhausted and the trend will reverse and an uptrend will begin. This condition is called “Bullish Divergence”.
Quesiton 8
Confirm a clear trend using the OBV indicator and combine another indicator of choice with it. Use the market structure to place at least two trades (one buy and one sell) through a demo account with proper trade management. (Screenshots required).
In this section, I will perform my transactions from my demo account on the Tradingview platform. In addition to the OBV indicator during my trades, I will use Moving averages.
ETH/USD pair Sell Position
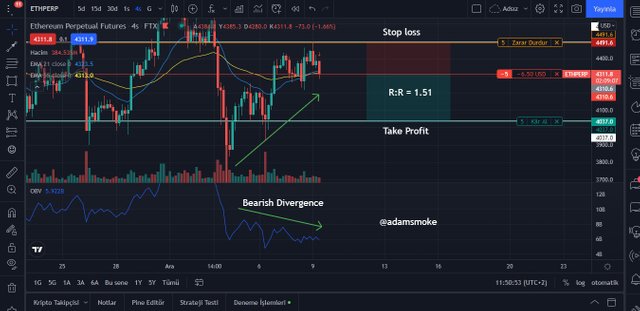
As you can see in the screenshot above, when we look at the price chart and our OBV indicator, we can see that there is a Divergence directly. We saw the Divergence varieties in the previous section and we understood that this Divergence is a "Bearish Divergence". Bearish Divergence tells us that the uptrend on the price is exhausted and will change direction and go down. That's why we're looking for our transaction as a sale. When I look at the Exponential moving averages later, I see that my short-term average is getting ready to cut my long-term average down again. This gives us a sell signal and I open my position as Sell. Then, with the Risk:Reward ratio not less than 1:1: I place my Stoploss level on the previous highest high and my Take Profit level on my support level, which has tested itself at least 2 or 3 times. Thus, our Risk:Reward ratio is 1.51.
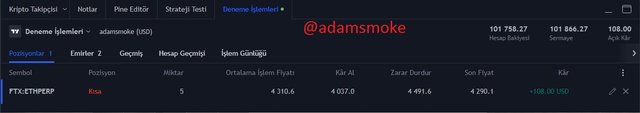
Transaction Summary:
- Entry Price = 4310.6 USD
- Stoploss = 4491.6 USD
- Take Profit = 4037 USD
- R:R = 1.51
BNB/USD pair Buy Position
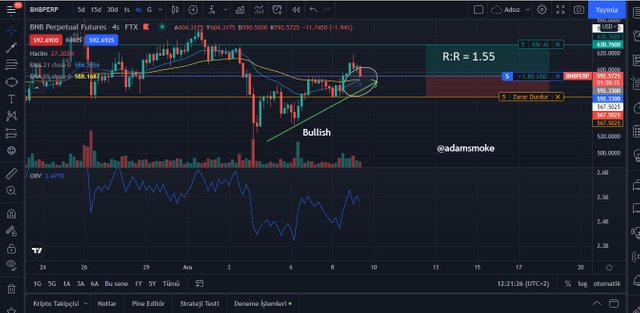
As we can see in the screenshot above, when we look at the price chart, we can see that there is a rise and this rise is supported by volume in our OBV indicator. This indicates that the upward trend will continue. Then when I look at my moving average: I see that my short-term average is preparing to cut my long-term average upwards, which gives me a buy signal. I then take my position as a buy. Then I set my Stoploss level to the previous low, which also appears as our multiple tested support level. Next, I place my take profit level at my peak before the start of the uptrend, with our R:R ratio not less than 1:1. Then, when we look at our R:R ratio, we see a ratio of 1.55.
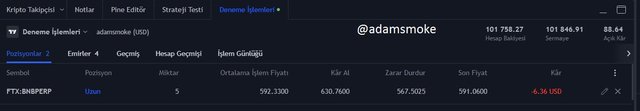
Transaction Summary:
- Entry Price = 592,330 USD
- Stoploss = $567.5025 USD
- Take Profit = 630.76 USD
- R:R = 1.55
Although my position is moving in the negative direction while I am sharing this, I believe that I can make a profit.
Question 9
What are the advantages and disadvantages of On-Balance Volume Indicator?
Advantages
- The OBV indicator is a very simple and understandable indicator. As we have said before, even someone who is new to trading can use it easily.
- The OBV indicator produces many signals such as determining the trend direction, price breaks and divergences, and gives the investor entry/exit or buy/sell signals with these signals.
- With the help of additional indicators, false signals given by the indicator can be easily filtered and enable more accurate trading.
- The OBV indicator can be used in almost all trading strategies.
Disadvantages
- As with every indicator, our OBV indicator does not work 100% correctly. For this reason, additional indicators should be used as confirmatory.
- The biggest disadvantage of the indicator is that it is open to price manipulations. Investors with large funds can hurt small investors by taking positions with high trading volume.
- In general, our indicator does not work properly in a consolidated market.
Technical indicators are traders' best friends. For this reason, when learning an indicator, we must make sure that we learn well with every point. Otherwise, we may misinterpret the signals and make an incorrect trade. That's why we covered almost all the points of the OBV indicator in this post and it was a very entertaining lesson.
Thanks to Professor @fredquantum and everyone who read my post for this nice lesson. See you in the next lesson.
CC: @fredquantum
Muy interesante su tema sobre este indicador. Muchas gracias por la información