Trading Crypto with Keltner Channels - Crypto Academy / S5W6 - Homework Post for @fredquantum
Introduction
Hello everyone,
In this post, one of the Crypto Academy professors, @fredquantum, has assignments for this week's lesson. The general subject of this post will be about “Keltner Channels”. Without further ado, I would like to start my sharing directly. Thank you to everyone who has already read my post and to professor @fredquatum for this nice lesson. I wish you all a healthy and peaceful day. Let's start!

Question 1
Creatively discuss Keltner Channels in your own words.
Keltner Channels
We make use of many indicators while performing our transactions on the market. In general, these indicators are technical analysis tools that allow us to trade more accurately and more clearly.
Keltner Channels is one such indicator. Keltner Channels basically measures the volatility in price action and is also an indicator based on that volatility. Our indicator was developed by Chester Keltner in the 1960s. However, it was later updated by Linda B. Raschke in 1980 using ATR (Average True Range).
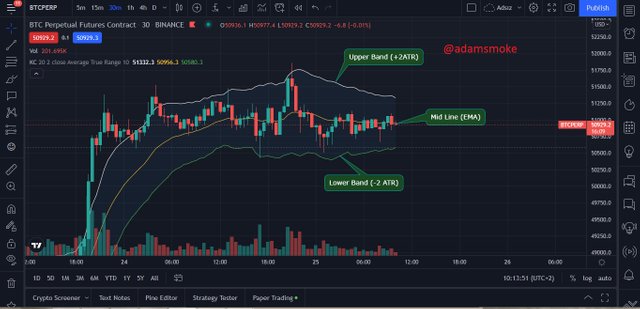
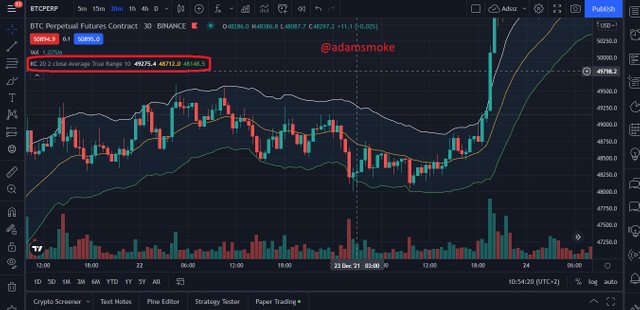
As you can see on our BTC/USD chart in the screenshot above, our indicator consists of 3 baselines. These lines are the upper band, the midline and the lower band. If we examine these lines more deeply:
- Mid Line: The Exponential Moving Average (EMA) is a 20-period period by default.
- Upper Band: It is the multiplication of a fixed value determined by the ATR value + EMA. By default, a constant value of 2 is used.
- Lower Band: Multiplication of a fixed value determined by the ATR value – EMA. By default, a constant value of 2 is used.
The main use of the indicator is: It is done by interpreting the movement of the price inside the channels of our indicator. In line with these movements, many interpretations such as trend confirmation, dynamic support/resistance, identifying breakouts, buy/sell signals can be made and we direct our trade.
Question 2
Setup Keltner Channels on a Crypto chart using any preferred charting platform. Explain its settings. (Screenshots required).
Installing Keltner Channels Indicator
In this section, I will use the Tradingview platform to add our “Keltner Channels” indicator to our chart.
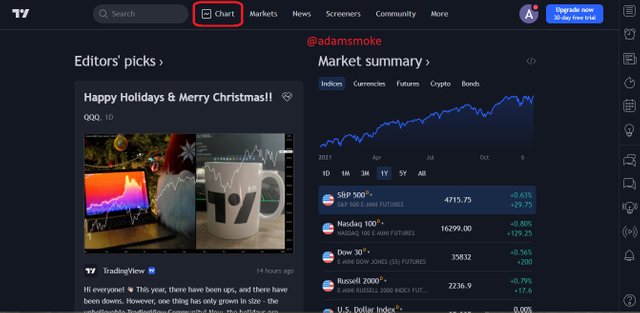
- First, we go to the Tradingview platform and click the "Chart" button on our homepage.
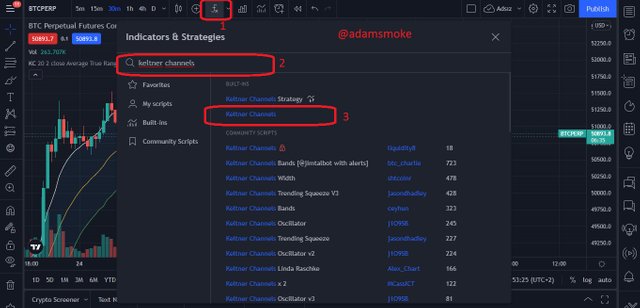
- Then we open an entity pair we want. Then we click on the “Indicators (Fx)” button at the top of our chart.
- Then in the menu that opens, we write “Keltner Channels” in the search section and click on it once. As a result of these operations, our indicator is successfully added to our chart.
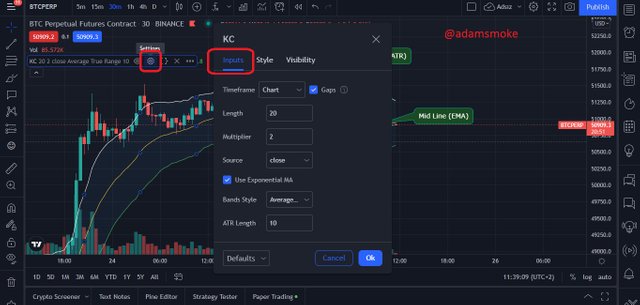
We have successfully added our indicator to our chart. Next we look at how we can structure our indicator. For this, we click on the “settings” button on our indicator. Later on:
- Inputs: In this section, there is an area where we can change the parameters of our indicator: There are parameters such as Timeframe, Lenght, Multiplier, Source, Use exponential MA (Band Style, ATR Lenght). The default settings in this section are as shown in the screenshot. These settings can be changed according to demand or trading method.
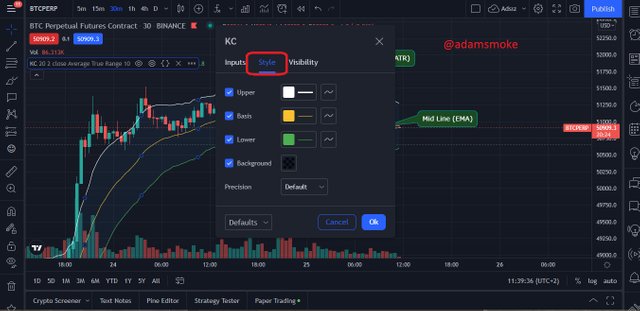
- Style: This section is a bit more personal. In this section, we can change the band lines and the Background color according to our wishes.
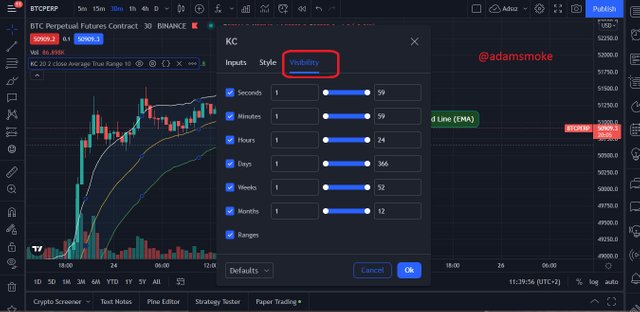
- Visibility: Time settings are available in this section. These settings should not be changed and it is not recommended to change them.
Question 3
How are Keltner Channels calculated? Give an illustrative example.
Keltner Channels Calculation
As we mentioned earlier, our indicator consists of three parts. These partitions are calculated as follows:
- Middle line (EMA)
- Upper Band (EMA + (2xATR)
- Lower Band (EMA – (2xATR)
EMA = Default 20 period period, ATR = Default 10 period period, Our fixed multiplier = 2
Now let's apply this formula on a practical example.
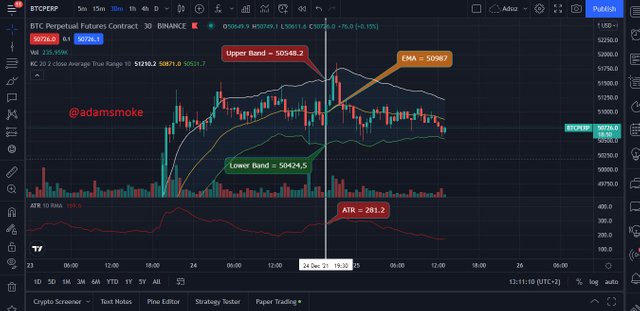
As we can see in the screenshot above, there is a chart of the BTC/USD pair. In this chart, the values at 19:30 on 24 Dec 2021, which I have determined with a vertical line, are shown. Now let's verify this calculation using our formulas.
Again, as we can see in the screenshot above:
- EMA = 50987 USD
- ATR = 281.2
If we remember our formula:
- Middle line (EMA)
- Upper Band (EMA + (2xATR)
- Lower Band (EMA – (2xATR)
- Middle line = EMA20 = 50987 USD
- Upper Band = EMA20 + (2xATR) = 50987 + (2x 281.2) = 51549.4 USD
- Lower Band = EMA20 – (2xATR) = 50987 – (2x 281.2) = 50424.6 USD
We get their values. When we look at the screenshot, there are minimal differences. The reason for this is that I make minimal mistakes while reading the values on the chart.
Question 4
What's your understanding of Trend confirmation with Keltner Channels in either trend? What does sideways market movement looks like on the Keltner Channels? What should one look out for when combining 200MA with Keltner Channel? Combine a 200MA or any other indicator of choice to validate the trend. (Separate screenshots required)
Trend Confirmations with Keltner Channels
Identifying the Trend on the market is important for every trader. Because we usually open our trades in the direction of the trend, and a trade that we open in the opposite direction of the trend can hurt us. For this reason, it is very important to know the direction of the market in order to perform a correct and profitable transaction. Now let's look at how to determine the direction of the market with our Keltner Channels indicator.
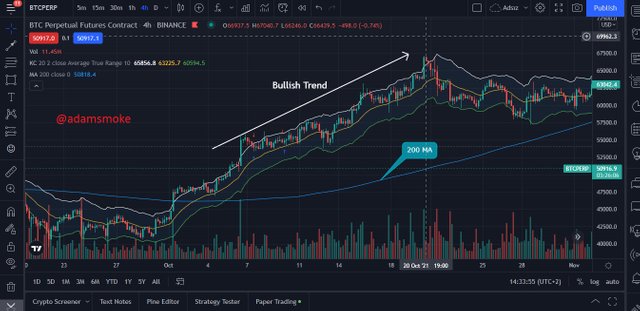
Bullish Trend
With Keltner Channels it is quite easy to determine the direction of the trend. Two points we need to pay attention to: the slope of the channel and the movement of the price within the channel. The price of our asset: it moves between the upper band and midline of the channel and the angle of the channel is up, showing us that the trend is a “Bullish”.
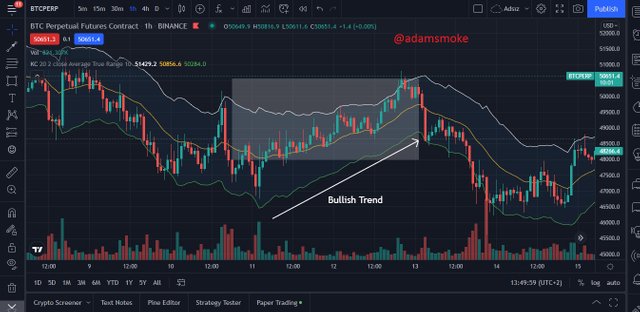
The above screenshot shows BTC/USD pair. Again, when we look at the shaded area in the screenshot: We see that the price is moving between the upper band and our middle line. When we look at the angle of our channel, we can clearly see that it is upwards.
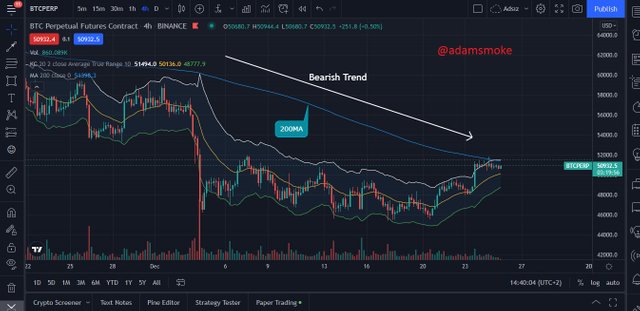
Bearish Trend
To confirm the Bearish Trend, two things are also taken into account: the movement of the price within the channel and the direction of the angle of the channel. If the price is moving between the lower band and our middle line, and our channel angle is downward, it shows us that our trend is “Bearish”.
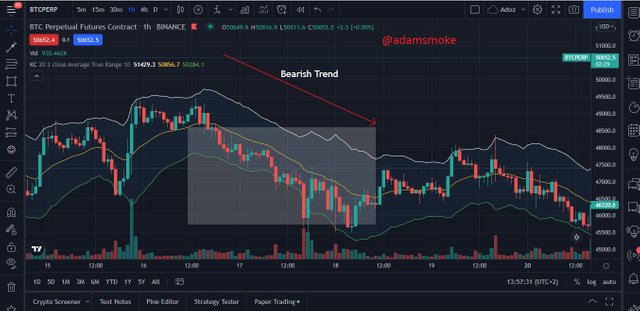
The above screenshot shows BTC/USD pair. Again, when we look at the shaded area in the screenshot: We see that the price is moving between the lower band and our middle line. When we look at the angle of our channel, we can clearly see that it is downward.
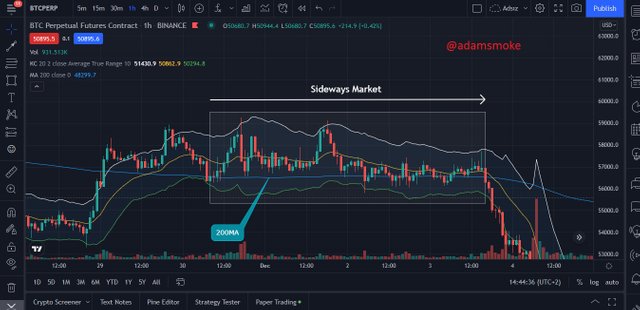
Sideways Market with Keltner Channels
Sideways market is when there is no trend on the market. Traders characterize this timeframe as the accumulation phase where a new trend will start to form, and it is not recommended to trade.
With Keltner Channels, this timeframe is pretty easy to determine. Sideways Market stage: Price moves close to our midline and the direction of the angle of the channel is not clear. That is, the channel proceeds in a straight line.
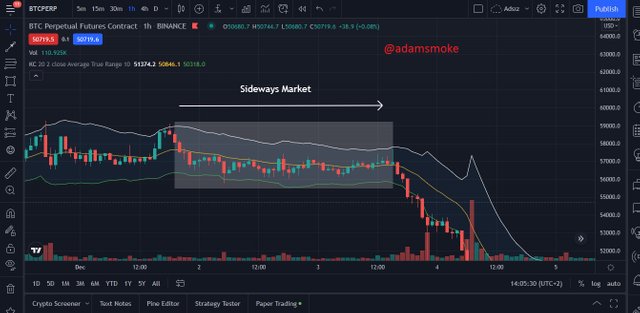
The above screenshot shows BTC/USD pair. Again, when we look at the shaded area in the screenshot: We can see that the price has formed small and unstable candles around the middle line. When we look at the angle of our channel, we see that it has no angle and moves straight. This allows us to understand that it is Sideways Market, as we said before.
200 MA with Keltner Channels
We know that not every indicator works 100% correctly, our Keltner Channels indicator does not work 100% correctly like all other indicators and therefore it is recommended to use it with an additional indicator. In this section, by combining our indicator with 200MA, we can strengthen the signals we receive and filter out false signals.
Bullish Trend with Keltner Channels and 200 MA
Confirming an uptrend is pretty easy when using the 200MA with Keltner Channels. If our 200MA line is moving below our Keltner Channels indicator, it indicates a strong bullish over the market.
The above screenshot shows BTC/USD pair. When we look closely at the screenshot, we see that the 200MA is moving below our Keltner Channels indicator.
Bearish Trend with Keltner Channels and 200 MA
Likewise, the Bearish trend is pretty easy to confirm. If our 200MA line is moving above our Kaltner Channels indicator, it indicates a strong bearish on the market.
The above screenshot shows BTC/USD pair. When we look carefully at the screenshot, we see that the 200MA is moving above our Keltner Channels indicator.
Sidewyas Market with Keltner Channels and 200 MA
We have said before that the Keltner Channels move in a straight line during the Sideways Market phase. At the Sideways Market stage, our 200MA line moves inside the Keltner Channels, showing us that there is no trend on the market.
The above screenshot shows BTC/USD pair. When we look carefully at the screenshot, we see that the 200MA moves inside our Keltner Channels indicator and cuts our channel. This shows us that there is no trend on the market.
Question 5
What is Dynamic support and resistance? Show clear dynamic support and resistance with Keltner Channels on separate charts. (Screenshots required).
Dynamic Support and Resistance with Keltner Channels
Support and Resistance levels: It can be interpreted as the point or points where the price of an asset reacts. When the price reaches the determined point, it rises or falls by seeing a reaction. Our support or resistance levels on the chart are generally drawn as straight lines. However, the same cannot be said for dynamic support or resistance levels.
Dynamic support or resistance level; are levels that constantly change with the movement of price. Dynamic support and resistance levels sometimes move on the lines found in our indicators. This also applies to our Keltner Channels indicator.
Typically in Keltner channels: Our upper band is our Dynamic Resistance level and our lower band is our Dynamic support level.
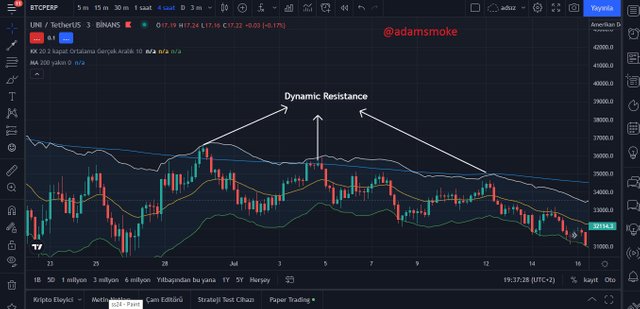
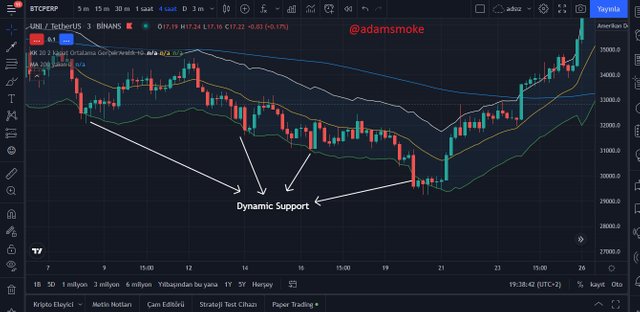
The above screenshot shows BTC/USD pair. As we can see in the screenshot: Our upper band worked as Dynamic resistance and our lower band worked as dynamic support. Paying attention, you can see that the price rises or falls after touching the points we have shown in the screenshot. However, we can see that these points are not the same levels and change according to the price movement.
Question 6
What's your understanding of price breakouts in the Crypto ecosystem? Discuss breakouts with Keltner Channels towards different directions. (Screenshots required).
After the market consolidates for a certain period of time, breaks occur at the determined support and resistance levels, and these breaks are generally interpreted as the beginning of a new trend. After these breaks occur, serious rises/falls occur on the market.
With Kaltner Channels, these breaks are easy to identify and easy to see. In the previous section, we saw how dynamic support and dynamic resistance levels work in the calcareous channels: Let's remember that the upper band is dynamic resistance and the lower band is dynamic support levels.
Your Price: When the price breaks our upper band (Dynamic Resistance Level) and the price moves out of the channel, this is called a “Bullish Breakout”.
Likewise: When Price breaks our lower band (Dynamic Support Level) and price moves out of the channel, it is called a “Bearish Breakout”.
Bullish Breakout
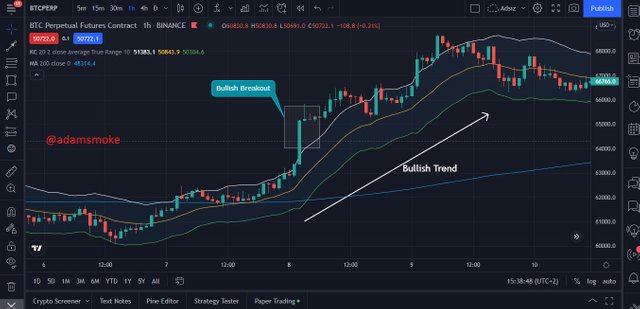
As we can see in the screenshot above: Price is breaking our upper band, which is our dynamic resistance level, and Breakout occurs. As a result, an uptrend begins.
Bearish Breakout
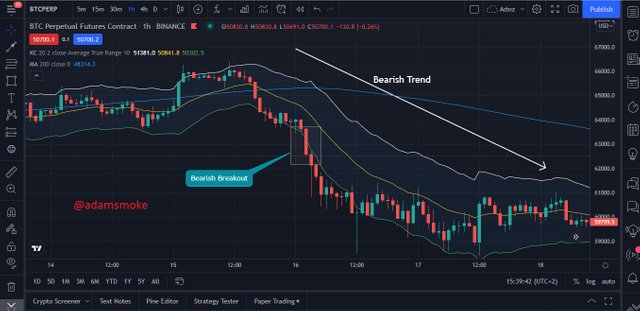
As we can see in the screen reminder above: the price is breaking our lower band, which is our dynamic support level, and the Breakout occurs. As a result, a downtrend begins.
Question 7
What are the rules for trading breakouts with Keltner Channels? And show valid charts that work in line with the rules. (Screenshot required).
Bullish Breakout Rules with Keltner Channels
- After a Konoslide market, we make sure the price breaks our upper band (Dynamic Resistance). Then, we make sure that the candle, which breaks through, closes above the upper band.
- After this breakout, a correction takes place and the price moves to use our middle line as support.
- We confirm this bullish move in price by waiting for 2 or 3 candles and then take our “Buy” position.
- After taking our position, our Risk:Reward ratio is not less than 1:1: our stopl-loss point is placed just below the EMA line.
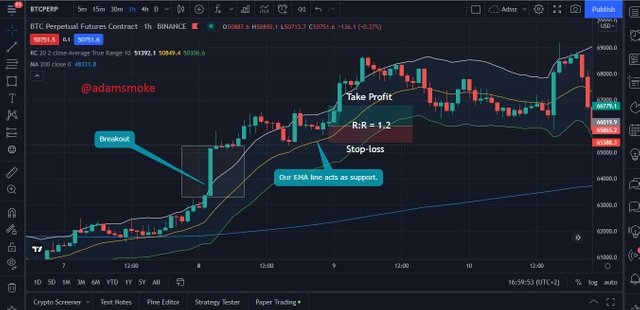
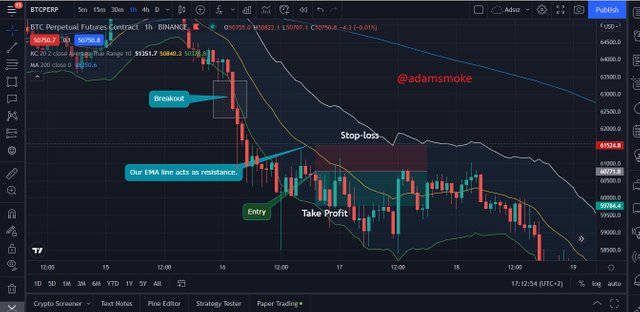
The above screenshot shows BTC/USD pair. As we can see in the screenshot: Price is breaking through our upper band (dynamic resistance). Then a price correction takes place. Then the price starts to move between the upper band and our middle line.
Then, as soon as the price uses our midline as support and starts rising back, I look at the 200MA and it is moving below the Keltner channels, confirming our trend. At the end of this, I comfortably take my position as “Buy”.
Bearish Breakout Rules with Keltner Channels
- After a consolidated market, we make sure the price breaks our lower band (Dynamic Support). Then, we make sure that the candle, which breaks through, closes below the lower band.
- After this breakout, a correction takes place and the price moves to use our middle line as resistance.
- We confirm this bearish move of the price by waiting for 2 or 3 candles and then take our “Sell” position.
- After taking our position, our Risk:Reward ratio is not less than 1:1: our stopl-loss point is placed just above the EMA line.
The above screenshot shows BTC/USD pair. As we can see in the screenshot: Price is breaking our lower band (Dynamic Support). Then a correction takes place in the price. Then our price starts to move between the lower band and our middle line.
Then, as soon as the price uses our midline as resistance and starts falling back, I look at the 20MA2 and see it moving above and below the Keltner channels. This means our trend is confirmed. At the end of this, I comfortably take my position as “Sell”.
Question 8
Compare and Contrast Keltner Channels with Bollinger Bands. State distinctive differences.
Bollinger Bands and Keltner Channels look physically the same. They consist of both: the lower band, the upper band, and the midline. Both are based on price volatility while being created. For this reason, the signals given by both are similar to each other, but they are not the same and there is a difference.
In the Keltner Channels, the upper and lower band gaps are narrower than the Bollinger bands. The reason for this is that ATR is used when calculating Keltner Channels. It uses SMA when calculating Bollinger Bands. As a result, Keltner Channels become a more price sensitive and early-reacting indicator. However, it can also produce more false signals than Bollinger bands.
As a result, both indicators are based on price volatility and we can use whatever we want depending on the way we trade.
Question 9
Place at least 4 trades (2 for sell position and 2 for buy position) using breakouts with Keltner Channels with proper trade management. Note: Use a Demo account for the purpose and it must be recent trade. (Screenshots required).
In this section, I will show my trades on the Tradingview platform with my demo account.
Purchasing Positions
Waiting for Bullish Breakout for my buy positions. Let's remember the Bullish Breakout rules:
- After a Konoslide market, we make sure the price breaks our upper band (Dynamic Resistance). Then, we make sure that the candle, which breaks through, closes above the upper band.
- After this breakout, a correction takes place and the price moves to use our middle line as support.
- We confirm this bullish move in price by waiting for 2 or 3 candles and then take our “Buy” position.
- After taking our position, our Risk:Reward ratio is no less than 1:1: our stopl-loss point is placed just below the EMA line.
ETH/USD Pair
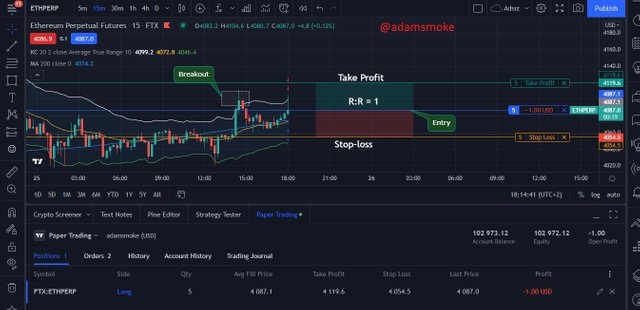
As we can see in the screenshot above, a breakout occurs and then the price starts moving above our upper band and midline. Then the price uses our middle line as support and starts to rise again. After waiting for a few candles, I take my position. I then set my Stop-loss and Take Profit levels so that our R:R ratio is not less than 1.
- Entry: 4087.1 USD
- Stop-loss: 4054.5 USD
- Take Profit: 4119.6 USD
- R:R = 1
ADA/USD Pair
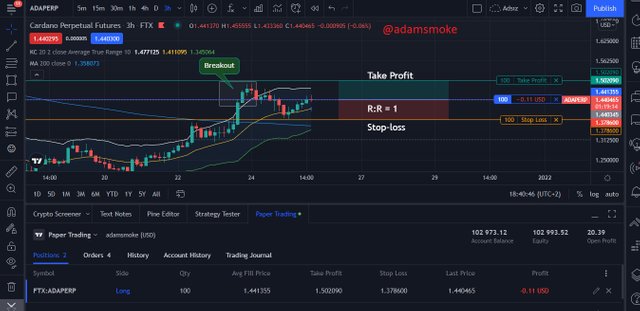
- Entry = 1.441355 USD
- Stop-loss: 1.378600 USD
- Take Profit: 1.502090 USD
- R:R = 1
Sell Positions
Waiting for Bearish Breakout for my buy positions. If we remember the Bearish Breakout rules:
- After a conoslid market, we make sure the price breaks our lower band (Dynamic Support). Then, we make sure that the candle, which breaks through, closes below the lower band.
- After this breakout, a correction takes place and the price moves to use our middle line as resistance.
- We confirm this bearish move of the price by waiting for 2 or 3 candles and then take our “Sell” position.
- After taking our position, our Risk:Reward ratio is not less than 1:1: our stopl-loss point is placed just above the EMA line.
FTM/ USD Pair
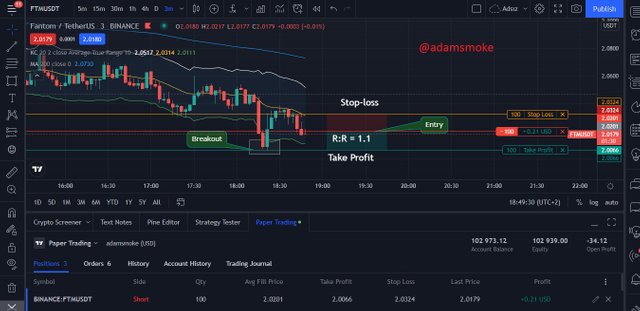
As we can see in the screenshot above, a breakout occurs and then the price starts moving above our lower band and midline. Then the price uses our middle line as resistance and starts falling again. After waiting for a few candles, I take my position. I then set my Stop-loss and Take Profit levels so that our R:R ratio is not less than 1.
- Entry: 2.001 USD
- Stop-loss: 2.0324 USD
- Take Profit: 2.0066 USD
- R:R = 1.1
UNI/USD Pair
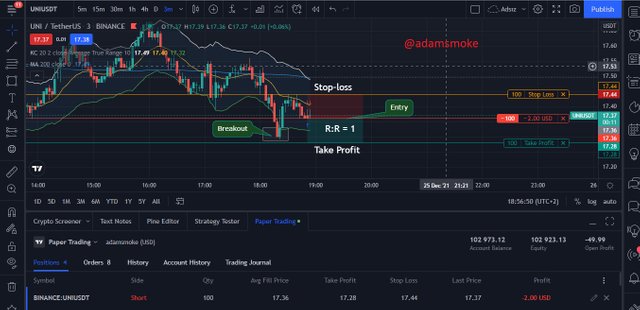
- Entry: 17.36 USD
- Stop-loss: 17.44 USD
- Take Profit: 17.28 USD
- R:R = 1
Question 10
What are the advantages and disadvantages of Keltner Channels?
Advantages of Keltner Channels
- Keltner Channels can be understood, used and interpreted more comfortably and easily than many indicators.
- It can be used in almost every trading method.
- Keltner Channels are very good at determining the direction of the trend and we can easily determine the direction of the market.
- Keltner Channels allow us to easily identify Dynamic support and resistance points on a consolidated market. However, we can see the breakouts on the market quite easily and we can take our position accordingly.
Disadvantages of Keltner Channels
- ATR value is used when calculating Keltner Channels, resulting in a more price sensitive indicator. This can increase the number of false signals received on the market.
- Although it is a price sensitive indicator, sometimes we may be delayed in reacting to price movements and we may be late for the position we will take.
- Like all indicators, it does not produce 100% accurate signals and therefore additional confirmatory indicators should be used.
Conclusion
In this post, we saw the “Kaltner Channels” indicator, which is one of the volatility-based indicators. The indicator is very easy to use for traders in many ways: Trend direction, breakouts, buy/sell signals, etc.
Besides, each indicator has its pros as well as cons. In this post, I tried to mention all the positive and negative information about the indicator. In addition, I have presented the differences of our indicator compared to another volatility-based “Bollinger Bands” indicator. It has been a very nice and instructive lesson for me in every respect. Thank you again to everyone who read my post.
CC: @fredquantum