Steemit Crypto Academy Season 2-Week4 Homework Post for @kouba01 | Cryptocurrency Trading with RSI

Hello to everyone.
The subject of our homework today is Cryptocurrency Trading with RSI. Thank you in advance to everyone who read my homework.

What is the Relative Strength Index - RSI and How is it Calculated?
RSI
RSI stands for Relative Strength Index. RSI was developed in 1978 by J. Welles Wilder, a mechanical engineer like me and the developer of many different indicators (ADX "Average Directional Index", Parabolic SAR "Stop and Reverse", ATR "Average True Range" ). RSI is classified as a "oscillator". In the financial sector, oscillator is a term used in predicting the buying and selling power of prices and the direction of prices. RSI allows us to detect any financial asset (such as Cryptocurrencies) overbought or oversold. RSI has a value between 0 and 100 and fluctuates between these values. It does not go above or below these values. In short, RSI allows us to track the trading percentage as in other indicators. This makes it easier for us to decide when to trade.
How is the RSI calculated?
There is no need to calculate the RSI ourselves during our technical analysis. Technical analysis software makes these calculations and directly presents graphs to us. However, if you want to calculate, you can calculate as I will show.
To calculate RSI, we first need to know what RS is. First of all, we set a period for ourselves.
Öncelikle kendimize bir periyot belirlememiz gerekiyor. The 14-day value is taken, which is typically used by Welles Wilder. We can change this if we want. But we should not forget that when we decrease this value, we get more signals. It's the opposite when we upgrade.
| Day | Closing | + Days | - Days |
|---|---|---|---|
| 1 | 2000 | - | - |
| 2 | 2050 | 50 | - |
| ... | ... | ... | ... |
| 13 | 2200 | ... | ... |
| 14 | 2100 | - | 100 |
RS: Arithmetic mean of the difference in positive closing prices for the last 14 days (P), arithmetic mean of the sum of the negative closing differences of the last 14 days (N) It is the division of their values. So:
RS = P / N
What we need to know when calculating RSI is the RSI formula.
RSI formula = 100 – ( 100 / (1+RS) )
After finding the value of RS, it is written in its place in the RSI formula. The resulting value is plotted on the chart and oscillates between 0 and 100.

Can we trust the RSI on cryptocurrency trading and why?
He can rely on the RSI indicator when we consider certain "RSI divergences" when it comes to cryptocurrency trading. RSI helps us see overbought and oversold signals. I use the RSI myself when trading. However, I use RSI as a verification factor. I do my technical analysis and then look at the RSI values. If the RSI values also approve me, I trade. It's safer to use RSI the way I use it. Because RSI may not always give correct signals. That's why we shouldn't just act on RSI values.

How do you configure the RSI indicator on the chart and what does the length parameter mean? Why is it equal to 14 by default? Can we change it? (Screen capture required)
I will show the RSI indicator on the tradingview site I use. First of all, we go to the website TradingView. Then we create a free membership. Then we follow the steps I showed with the screenshots.
Step 1
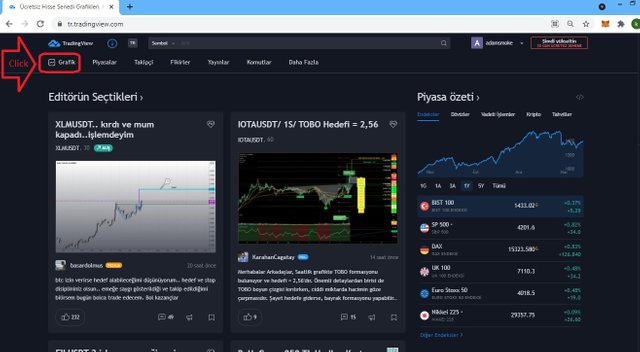
We click on the graphics section from the area I show with the box.
Step 2
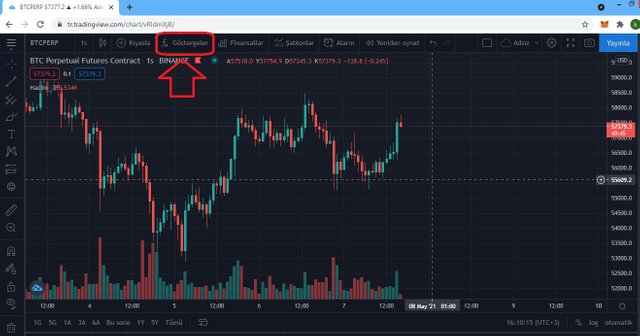
We click on the "fx" button that I show with the box.
Step 3
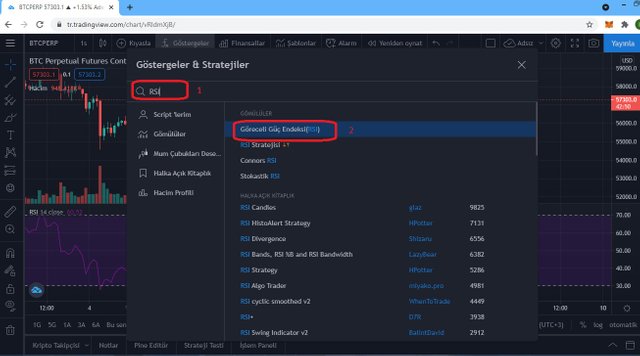
Then we write "RSI" where I show it with box number 1 and select the option I showed with box number 2.
Step 4
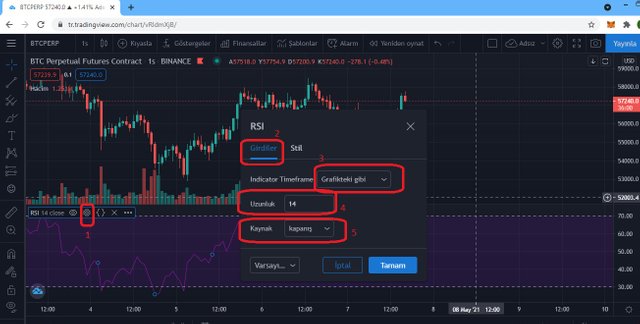
In this step, when we click on the field shown with the number 1, a screen like this will appear.
The places I show with numbers on this screen are useful for:
Box number 2: "In punts": this field contains "length", "source", "indicator timeframe" settings.
Box number 3: "indicator timeframe": This field contains the graphic time setting.
Box number 4: “length” : In this field, it specifies the number of days to be taken into account in the arithmetic mean. It is 14 by default. We can change this number. However, when we change it, it changes in the signals it gives.
Box number 5: “source” : It is the price that will be used in the equation. It has options such as open, close, highest, lowest.
Step 5
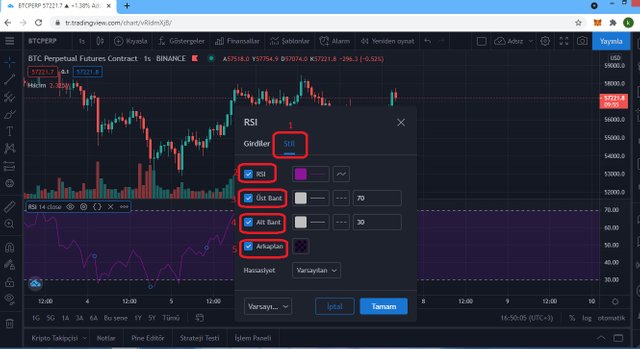
In this step, we have a screen that opens when we click on the "style" field shown in box 1.
This area includes:
Box number 2: “RSI” In this option, graphic shape and color are determined.
Box number 3 and box number 4: In this area, we have lower and upper band settings.
Box number 5: “Background”: In this area, there is the background setting of our chart.

How do you interpret the overbought and oversold signals when trading cryptocurrencies? (Screen capture required)
I am interpreting the overbought and oversold signals by looking at the RSI chart review. I interpret fields above 70 as overbought and areas below 30 as oversold.
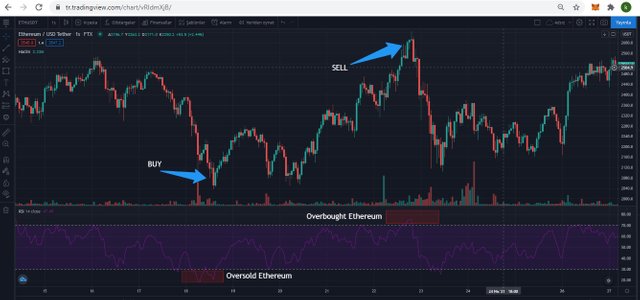
While trading, we shouldn't buy tokens in places with overbought. If there are any, we sell the tokens we have and expect the price to decrease. We have to buy in the oversold region. because after overbought and oversold the market reverses.

How do we filter RSI signals to distinguish and recognize true signals from false signals. (Screen capture required)
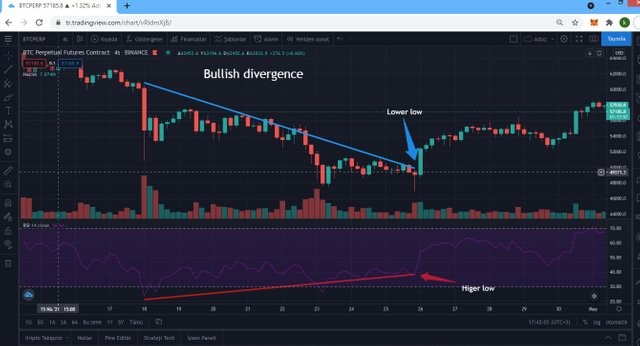
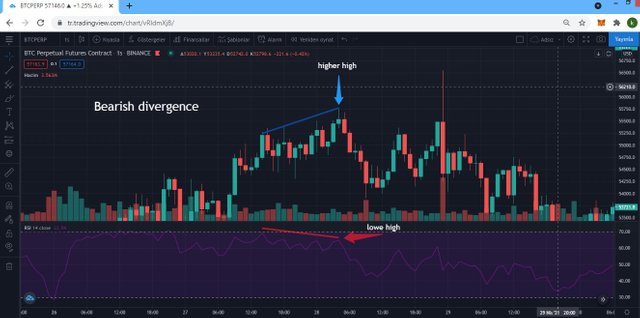
As we said before, RSI does not always show the correct result. While the RSI is rising, the market may be in a bearish trend. likewise, the market may tend to rise while the RSI is falling.
We can define them as "bullish divergence" and "bearish divergence".
Bullish divergence:
Bearish divergence::

Review the chart of any pair (eg TRX / USD) and present the various signals from the RSI. (Screen capture required)
BTC / USDT
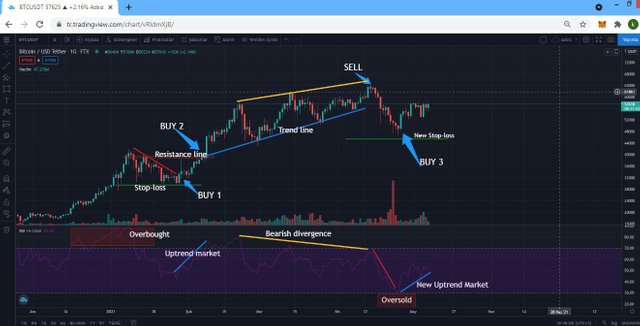
In this chart analysis I have looked at the BTC / USDT pair. First of all, we pay attention to compliance with RSI while analyzing the chart. There is a consistent drop after the overbought zone as I show in the screenshot. Even though this decline is not in the oversold zone, it is enough for us to trade. When the drop is over, we buy some when the uptrend market becomes. When we see the uptrend market continuing, we make a second and higher purchase from a resistance zone we have determined. We sell when the market starts to fall from the overbought zone. We expect the market to come back to the oversold zone. We are doing our graphical analysis again. When there is a decline consistent with the RSI, we can buy again in the oversold zone. But of course, we need to see that our new Uptrend market has been approved.
We do not neglect to put our stop-losses that we set while trading.

CONCLUSION
what is the RSI in this lesson? How is the RSI calculated? We have shown in detail the answer to their questions. We explained the RSI configuration in detail with screenshots. We explained how to use RSI and the aspects we need to pay attention to in RSI. Then we explained which signals we take into account when trading. We learned well what to do in the overbought and oversold zones. Finally, we examined the BTC / USDT pair. I have shown with a screenshot where we should pay attention to RSI in chart analysis. We've seen what the RSI compatibility does when trading.
Although I know how to use RSI, I noticed that I had many shortcomings in this tutorial. I learned some of these shortcomings while doing my homework.
Thank you to professor @kouba01 for this nice and instructive assignment. I'm looking forward to your other homework.
CC:
@kouba01
Hello @adamsmoke,
Thank you for participating in the 4th Week Crypto Course in its second season and for your efforts to complete the suggested tasks, you deserve a 7/10 rating, according to the following scale:
My review :
Well-organized job, your answer was fairly successful. Some questions lack some analysis and accuracy.
Thanks again for your effort, and we look forward to reading your next work.
Sincerely,@kouba01
Thanks professor @kouba01 for your note and interest. I will be more successful in other lessons.