Steemit Crypto Academy - Season 2, Week 8 / Homework Post For @fendit : The Wyckoff Method
.png)
Introduction
Hello everyone
First of all, before starting homework, I wish everyone a happy and healthy day. Today we will cover the Wyckoff method and composite man in Professor @fendit homework. We will then show the Wyckoff cycle on the graph using this method. That's why we learn these methods first.

1. Share your understanding on "Composite Man" and the fundamental laws. What's your point of view on them?
The Wyckoff Method
First of all, we should know that the Wyckoff method is one of the technical analysis tools. It was developed by Richard Demille Wyckoff in the early 1920s. Richard Demille Wyckoff has done many studies throughout his life. He devoted much of his life to teaching and has had an influence on much of modern technical analysis today. Wyckoff developed many of his studies as a result of studying the trading methods of successful traders. Wyckoff methods, like many other methods, are among the methods of a certain popularity. Although the Wyckoff method was initially used on stocks, it was later applied in all financial markets.
- So what is the Wyckoff method in essence?
To define the Wyckoff method in general, it is a method that allows us to establish a supply and demand relationship by analyzing the transaction volumes and price movements in any asset market, and as a result, to make a price prediction on the market. Wyckoff therefore relies on three fundamental laws.
- What are these fundamental laws?
These basic laws are as follows: "Law of Supply and Demand", "Law of Cause and Effect", "Law of Effort and Effect" are divided into 3 groups.
Law of Supply and Demand
This law is used in price estimation, as we used to describe the Wyckoff method earlier. So how do we use this? When demand is greater than supply in a market, prices are expected to rise. Conversely, when demand is greater than supply, prices are expected to fall. We can show it this way.
- Demand > Supply = Price goes up.
- Supply > Demand = Price goes down.
- Supply = Demand = No price change is expected.
In Turkish
- Talep > Arz = Fiyat yükselir.
- Arz > Talep = Fiyat düşer.
- Arz = Talep = Fiyat değişikliği beklenmez.
Law of Cause and Effect
This law is directly related to the Law of Supply and Demand. This is because nothing happens on the market for no reason. For this reason, certain events pass through a preparatory period and reach their conclusion. This is explained in Wyckoff terms as follows;
- Accumulation, this is a period of accumulation, and if we characterize it as a "cause", the result will be a rise in price. This rise is called “effect”.
- Distribution, this is a distribution period, and if we qualify it as a "cause", there will be a decrease in price as a result. We refer to this decrease as “effect”.
Law of effort vs Result
This law is the relationship of an asset to its trading volume. This relationship can be explained as follows;
If the price movements are in line with the trading volumes, it indicates that the trend will continue in the same direction. But if the volume and price differ, it shows us that the Trend will change or stop. If we want to relate it simply, it would be like this:
- High Volume = Big Effort
- Low volume or sideways movements in the chart = Less Effort
To explain this more clearly with an example:
Suppose an ETH (Ethereum) market is in a major downtrend. Next, let's consider it consolidated with very high volume (where a trend is not formed, the price is sawing through a band). This very high volume shows us a great effort. But low volatility (meaning that an asset's value does not fluctuate dramatically and tends to be more stable) shows us a small "effect". The main point we want to explain here is, In this example, we saw that high amounts of ETH were exchanged, but there was no decrease in high amounts. So what should we understand as a result of this? In such a situation, we do not understand that the ongoing downtrend in the market has reversed or is imminent.
Composite man
Composite man, in short, is the imagination of large investors and institutional traders in the market as a single person and analysis is done in this way. The main purpose of the composite man is to buy an asset at a low price and sell it at a high price. That's why the composite man always acts in his own interest.
Although the composite man does not exhibit an ethical behavior, almost all of us can exhibit this behavior because we want to win due to human nature. Although we are not a large investor or an institutional investor, I do not see any difference between the composite man and many other small traders as we trade on their movements during our trades. This applies to me. Because if we want to make money in the market, we must follow the rules of the market and act in this direction, otherwise we will only lose money.
The rules of the market, in my opinion, consist of a good market analysis, a good psychological analysis and technical analysis. The better we do market analysis and technical analysis, the higher our profits will be. One of the best methods I will pay attention to and use during my technical analysis is to act together with the composite man. Because, as we all know, there are a lot of whales in the market. It's safe for me to act with the composite man. However, we should not stick to a certain point during our transactions. We should also take advantage of additional indicators (like RSI, MACD, etc.) in our trading. Thanks to these indicators, we should confirm the transactions we will take and open our position accordingly. Another point we should remember is that the opportunities in the market will never end and we should act more cautiously accordingly.
Although many trading methods such as Wyckoff emerged many years ago, the reason why they are still used is that these methods work. As long as we can understand how these methods work or how they act, I think small traders can generate good incomes.
According to Wyckoff, this composite thinks the man's movements are predictable. He thinks that if we can understand these movements, we can predict and predict the prices of assets. However, while doing this, we need to do market and chart analysis.
- There is a cycle of four Phases that the composite man applies.
Phases
I will share with you the image used by Professor Fendit so that we can see these Phases more clearly on the graph.
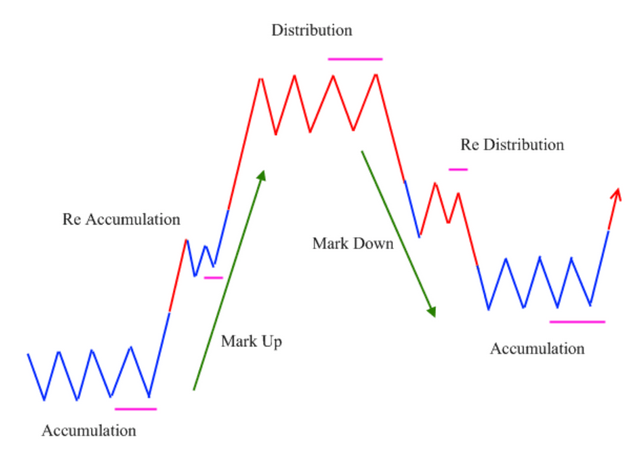
- Accumulation:
It is the stage where there are no big changes in price and volume and therefore the graph goes phases. At this stage, the composite man accumulates his holdings before other investors enter the trade.
- Mark Up / Uptrend:
Once the composite man has enough savings and the supply drops, he starts raising the price. then it manages to attract other traders who see this upward movement to the asset they have accumulated, and as a result, it causes an increase in demand. there may also be more than one accumulation phase at this phases.
- Distribution:
At this phases, the composite man begins to profitably distribute his assets to the late market entrants. At this phases, the market follows a sideways movement as it will slowly sell its savings until the demand decreases completely.
- Markdown / Downtrend:
At this phases, after the composite man has sold most of his holdings, he will try to bring the market down and many of the traders will start selling their holdings due to the drop in price. As a result, there will be a downtrend. During this downtrend, there can be multiple distribution points, just like in an uptrend.
2. Share a chart of any cryptocurrency of your choice (BTC or ETH won't be taken into account for this work) and analyze it by applying this method. Show clearly the different phases, how the volume changes and give detail of what you're seeing.
In this section, I will show you all the phases of the Wyckoff cycle with a screenshot on the 4-hour chart on the FTM/USD pair via Tradingview.com.
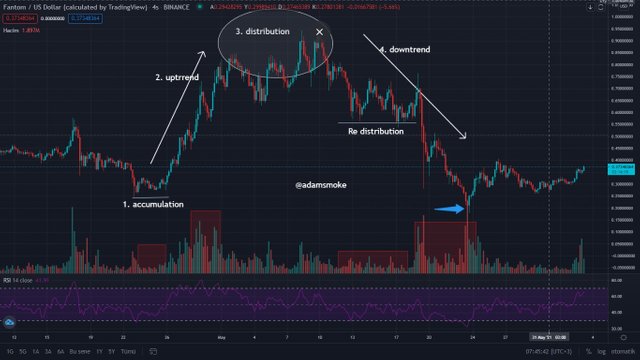
Accumulation: in this section, the market moves horizontally. There is no big change in trading volumes during this horizontal movement. The price moves steadily.
Uptrend: Although the market is in a downtrend, there has been a nice uptrend and a price increase. As seen in the chart and trading volume, the market is rising. We also see this uptrend in the RSI indicator.
Distribution: I showed the points where the trading volume started to increase again, but the price did not increase any more and peaked. After this point, many investors start the selling process. Therefore, the price is prepared to drop.
Downtrend: at this stage the price starts to drop. Again at this stage, there is 1 Redistribution point. I have indicated this point with a line. It is also seen in transaction volume. After this redistribution point, the price drops again until it becomes an accumulation point.
Conculision
In this lesson, we learned the Wyckoff method. Later, we learned what kind of strategy the composite man character, which we defined as an imaginary identity, followed and we showed the Wyckoff cycle on the graphic. Although the Wyckoff method may seem difficult at first, after understanding the method, I realized that it is a simple, logical and functional method.
I would like to thank firstly Richard Wyckoff for this method and then professor @fendit who taught me this course.
CC: @fendit
Thank you for being part of my lecture and completing the task!
My comments:
It was all ok, explanations were really good and you were able to identify the pattern correctly in the chart!
Nice job! :)
Overall score:
7/10
Yes, my daily language is Turkish. In order to do my homework more regularly, I do Turkish first. Then I translate carefully. But here I forgot to translate from Turkish to English. I can edit it again if you want, professor @fendit
I follow such a way because my English level is not very good. In this way, I do my homework more regularly and in a way that I can understand.
Thank you for your attention.
I've edited the point you have shown with the screenshot in my assignment so you can understand, professor @fendit
Hello professor @fendit . Will my homework not be graded?
Oops, sorry! Fixed it! :)
Thanks professor. I'll be more careful next time. :)