Introduction to the Principles of Crypto Analysis | Crypto Academy - S4W7 | Homework post for @imagen
Introduction
Hello to everyone,
Professor @imagen's assignments are available in this post. Our topic is fundamental analysis and technical analysis. Without further ado, I want to get to the point. Let's start!

Question 1
What are the differences between Fundamental Analysis and Technical Analysis? Which one is used most often?
Before we can fully understand the differences between technical analysis and fundamental analysis, we need to make sure we know what they both mean. Let's talk about this information briefly.
Fundamental analysis is based on obtaining information about the good or bad course of all assets (stocks, cryptocurrencies, commodities, etc.) traded in the market and interpreting it within ourselves. In short, it is necessary to obtain all the information in our minds about a project, and while acquiring this information, the questions in our minds must be resolved. This information:
What the project is about and what it promises in real life, what the project aims at, what the roadmap is and what it talks about in the WhitePaper, what sectors it serves, whether there are other competitors in the market, what the founding team does and what its achievements are, market capitalization, etc. . It is an analysis method where we find answers to many questions.
When we invest in an asset in the light of this information we have obtained, we make the right investment.
Technical analysis goes through examining the price chart of the asset we want to invest or the asset we want to trade. It is an analysis method that people who trade in the market must know. All investors (We) have one purpose in the market; to win. The more information we have about the course of an asset's price, the more we can earn. Technical analysis is one of the ways we interpret this trend in the market.
Technical analysis method consists only of interpretation of price movement and does not include other factors (Political, social, etc.). Technical analysis generally allows us to identify trends on the market and buy/sell accordingly. These; uptrend, downtrend, Fibonacci, Elliot, etc. There are many technical analysis methods such as
In addition to all these, if we consider that the main effect on the market is human, we can more easily see that the price movements develop within certain patterns. For this reason, many formations are used on the market; pennants, flags, wedges, Head to shoulder head, double top, reverse double top, etc. There are many formations such as In addition to these formations, there are indicators for easier and more accurate analysis of the movements on the market. These indicators give us information about the current state of the price. E.g; In its most basic sense, the RSI indicator shows us that the price is in an overbought or oversold zone. This was just an example and many indicators like this allow us to have an easier idea of the market.
To sum up, Technical Analysis is the interpretation of an asset's price chart by traders.
If you want to learn more in depth, your professor @imagen's In this week's Lecture for more detailed information.
Differences Between Fundamental Analysis and Technical Analysis
| Fundamental Analysis | Technical analysis |
|---|---|
| Fundamental analysis is a versatile study of a project to determine the true value of an asset. | Technical Analysis is a method of predicting and interpreting the future movement of price using charts while identifying patterns and trends. |
| Fundamental Analysis is a very important analysis method for our long-term investments. In short, it is an analysis method that should definitely be applied for the assets we will buy as investments. | Technical Analysis is important for short-term investments in general. It is suitable for short-term trades on the market. |
| The purpose of Fundamental Analysis is to calculate the true value of the asset. | In Technical Analysis, it is important to correctly determine the entry and exit times for our position. |
| The decisions we will make in Fundamental Analysis are based on available information and are statistically evaluated. | In Technical Analysis, on the other hand, decisions are based on market trends and the price of the asset. |
| It focuses on both past and present data. | It focuses only on historical data. |
| In general, all events are examined; Economic reports, news, industry statistics, etc. | In general it is based only on Graph analysis. |
| future price of the asset; It is estimated from the past and present performance of the project, the profitability of the company and its future plans. | future price of the asset; It is based on charts and indicators. |
| Suitable for long-term position traders. | Suitable for swing traders, short-term day traders, scalping traders. |
Question 2
Choose one of the cryptoassets below and do a Fundamental Analysis that shows the purpose of the Project, Financial Metrics and On-Chain Metrics.
• Cardano (ADA)
• Left (LEFT)
• Terra (AY)
• Chiliz (CHZ)
• Polkadot (DOT)
Chiliz (CHZ)
The Chiliz project is a project that has increased its popularity since its release. Chiliz was first released by Socios.com in 2018 and has the CHZ Token. The CHZ token features ERC20 and is built on the ethereum network.
The Chiliz project is entertainment, Sports themed. It aims to provide interaction between sports organizations and their audiences (fans). It also allows viewers to earn money while interacting. In this way, it aimed that the fans have a say in many issues in the sports organization they support, and it has succeeded in many aspects. If we give an example of this interaction; best selection of players in the club, product and kit designs for the club, which players will be transferred, etc. It allows the fans to have a say on many issues.
Chiliz has become so famous that many sports clubs in my country have also issued their own tokens thanks to the Chiliz project; Galatasaray Sports Club, Trabzonspor Sports Club. For this reason, we can say that it is a project that I like to follow, and it is a project that I think will increase in value in the future.
Chiliz Financial Metric Analysis
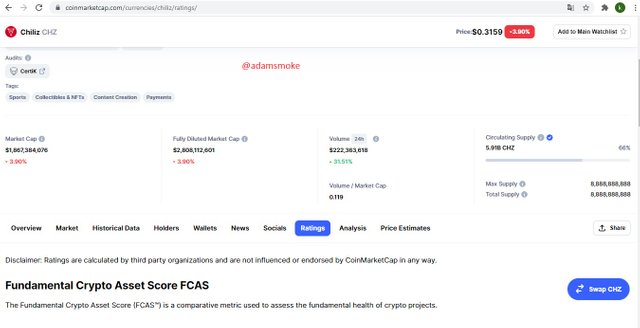
As you can see in the screenshot above:
- Market Cap: 1,867,384,076 USD
- Volume 24H: $222,363,618 USD
- Liquidity: 0.119
- Circulating: 5.91 Billion CHZ (66%)
- Max Supply: 8,888,888,888
- Total Supply: 8,888,888,888
Looking at the above information; When we take a look at the circulating CHZ amount, Max Supply and total supply values, 5.91 Billion of the 8.8 Billion CHZ amount is in circulation and this value is a really good value.
When we look at the liquidity of the market, we see the value of 0.119. We can say that this value is a very good value and has a liquidity market. Therefore, I do not think that we will experience a loss in value when buying and selling the asset.
In-Chain Metric Analysis
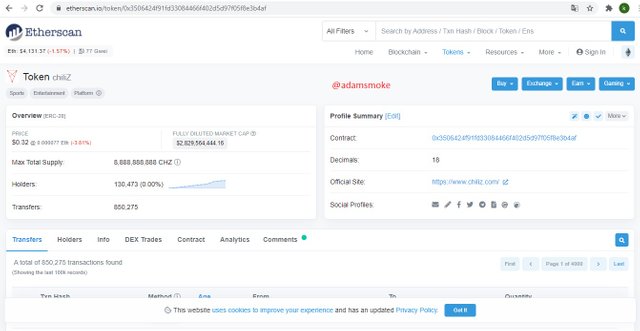
Chiliz is a project built on the Ethereum blockchain and therefore has all the features of the Ethereum blockchain. As you can see in the screenshot above, if we look at the data we received over the Etherscan platform;
- Contract: 0x3506424f91fd33084466f402d5d97f05f8e3b4af
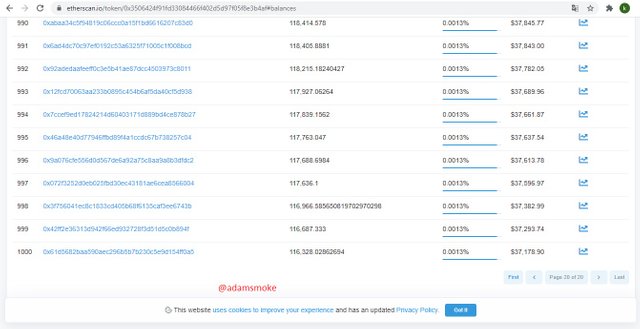
Again, according to the information we obtained through the EtherScan platform, there are more than 1000 CHZ owners.
These beautiful values and the Ethereum blockchain network it is built on clearly show that we need to invest in the Chiliz token. Chiliz is also a project with its own ecosystem. If the tokens of the teams you support are available in this ecosystem, you can buy and sell the tokens of the team you support on the Chiliz exchange with your CHZ coins. It is another feature of this platform.
Quesiton 3
Make a purchase from your verified account of at least 10 USD of the currency selected in the previous point. Describe the process. (Show Screenshots).
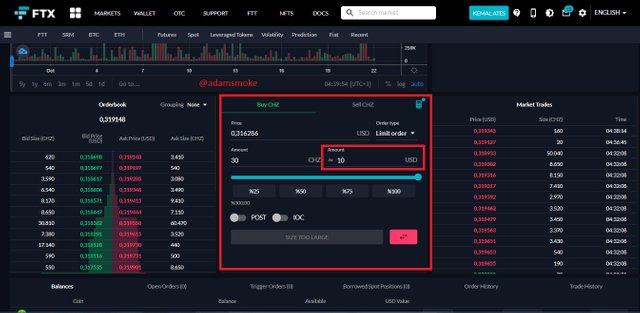
In this section, I will perform my transactions from my verified FTX exchange account.
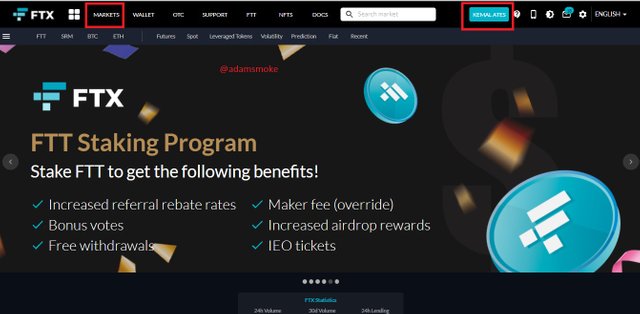
- First, we go to the FTX platform and log in to our account.
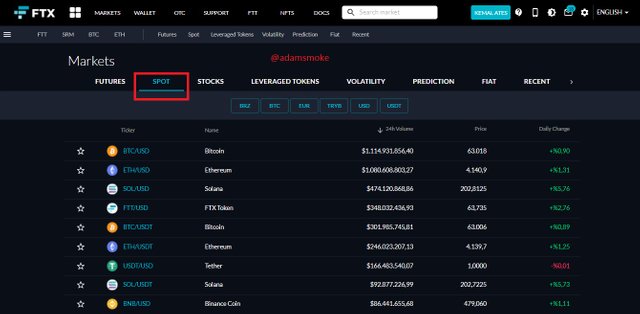
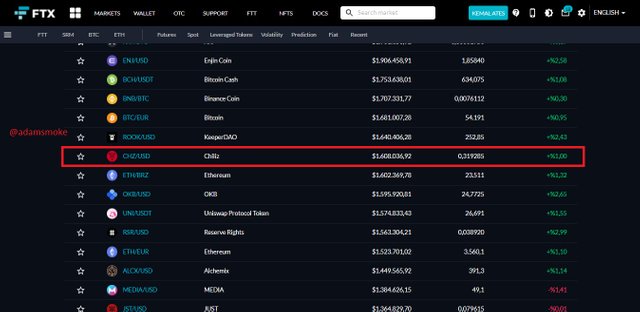
- Then click on the markets section. Click on the Spot section on the screen that appears. Then we find the CHZ token to buy and click on it.
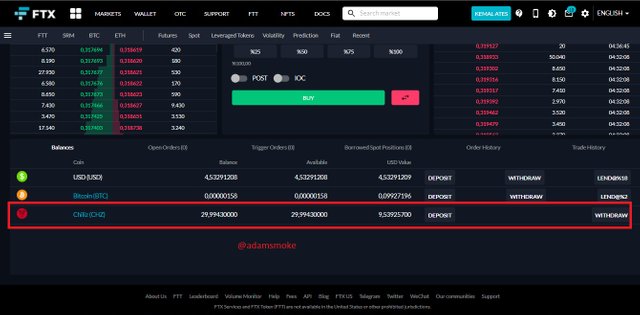
- Then we come to the Buy CHZ section on the screen that appears. In this section, we enter the amount of CHZ tokens at which price, and after saying Buy, our CHZ amount is added to our Spot balance.
Quesiton 4
Apply Fibonacci retracements to the previously selected asset with a 4 hour time frame on the platform of your choice. Observe the evolution of the price at 24 and 48 hours, did it go up or down in value? Look to identify resistance and support levels. (Show Screenshots at 0, 24 and 48 hours of purchase where the date and time are observed).
In this section, I will perform my screenings on the Tradingview platform and make my purchase from the FTX exchange.
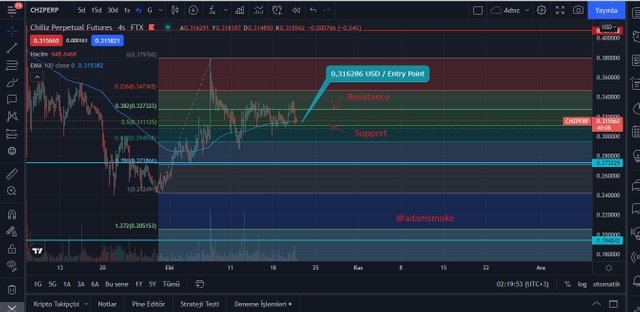
As you can see in the screenshot above, I used the Fibonacci Retracement for the CHZ token. After placing my Fibonacci retracement, I checked if it worked. Price had correctly used our Fibonacci levels as support and resistance. When I examined the price more deeply, our 0.5 level was acting as a strong support and resistance. The price had tested the 0.5 level many times. Our 0.5 level is actually an average level of the price. I could have waited for the 0.618 level to buy, but the 0.5 level was a strong support level as we said before. Therefore, I thought that the price would rise back from this level and I made my purchase.
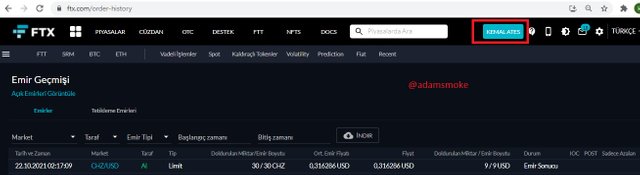
Here is my position summary as you can see in the previous section and above:
Purchase Price: $0.316286 USD
Amount Purchased: 10 USD
Amount of CHZ Received: 30
Operation date: 22/10/2021, 02:17:09 UTC time
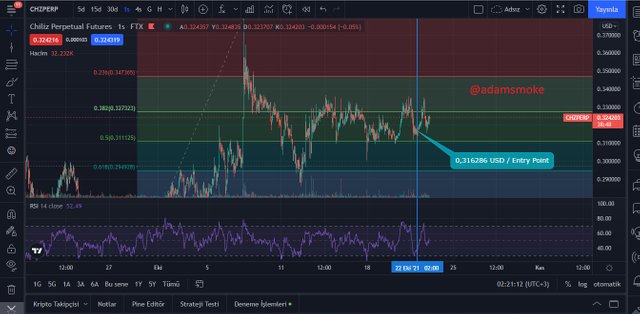
As you can see in the screenshot above, CHZ price surpassed the 0.382 Fibonacci level, but declined back. The price is moving sideways to this, indicating that the market is in a trend preparation. Therefore, the price can both fall and rise. We'll have to wait and see.
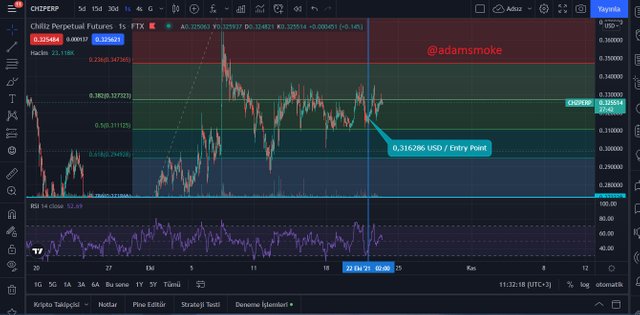
Since I won't be able to check my position after 48 hours, I'm taking a look at its 36 hours later. Our price approached the 0.382 level and showed an increase by reaching the value of 0.325514 USD.
Quesiton 5
. What are Bollinger Bands? How do they apply for Crypto Technical Analysis? What other tool or indicator do you combine Bollinger Bands with to analyze a Crypto? Justify your answer.
Bollinger Bands (BB)
BB was first developed by John Bollinger in the 1980s. BB is a volatility band that is placed above and below the moving average and is often used in technical analysis. Since volatility is a variable based on Standard deviation, any rise or fall in volatility also affects the standard deviation. Therefore, BB expands when volatility increases and contracts as volatility decreases. For this reason, BB tells us whether the price is high or low. According to John Bollinger, the price moves within 88-89% BB, and when the price moves outside of the BB, he describes it as unusual.
From a technical point of view, if the price is close to the upper band in BB, the prices are relatively high, and if it is close to the lower band, the price is relatively low. These movements of the price give us a buy or sell signal.
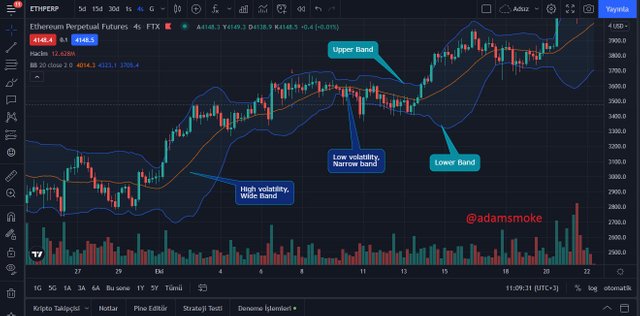
As we can see in the screenshot above, the upper and lower bands are shown. In addition, it has been shown that price volatility is high in the wide band range and low volatility in the narrow band range. Likewise, if the price is constantly moving close to the upper band, this indicates that there is an increase for us, and if the price moves close to the lower band, this indicates a decrease.
The BB indicator is a volatility indicator and it works beautifully. However, like many other indicators, it is a lagging indicator and can often be late in generating signals. Therefore, using it alone would not be a correct strategy. Because everything can change instantaneously in the market, and a late signal may mean that we missed a trading opportunity that could be profitable for us. In addition, no indicator works 100% correctly, and therefore, like many other indicators, additional indicators can be used as a confirmatory. For example, using the RSI indicator, it can be verified whether the price is really low or high. Because the RSI indicator gives us signals that the price is in the overbought or oversold zone. When BB and RSI are used together, more accurate entry points or more accurate exit points can be determined.
Conclusion
This lecture of the professor had almost all the information about fundamental analysis and technical analysis. Technical analysis and fundamental analysis methods help us make more accurate decisions in our trades on the market. In this way, we can get more profits from our trades.
In this post, I briefly talked about fundamental and technical analysis and tried to tell you what the differences are between them. In the continuation of the sharing, we applied certain fundamental and technical analysis methods about the Chiliz project.
I would like to thank Professor @imagen and everyone who read my post for this beautiful and instructive course, which is easily understood to be a great effort. I wish you all a healthy and beautiful day.
CC: @imagen

Gracias por participar en la Cuarta Temporada de la Steemit Crypto Academy.
Continua esforzandote, espero seguir corrigiendo tus asignaciones.