[Crypto Trading With SuperTrend Indicator]- Crypto Academy /S5W7-Homework Post for @kouba01
.png)
Introduction
Hello everyone,
In this post, professor @kouba01 has assignments for this week's lesson. The main topic of this week's lesson and this post is about “SuperTrend Indicator”. Therefore, you will find answers to many questions about our SuperTrend indicator in this post. Without further ado, I would like to start my sharing. Thank you to everyone who reads my post. Let's start!

Question 1
Show your understanding of the SuperTrend as a trading indicator and how it is calculated?
SuperTrend Indicator
When taking our positions during our trades, we usually trade in the direction of the trend. For this reason, it is important for every trader to correctly determine the direction of the trend on the market. We use trend following indicators to accurately determine the direction of the market. One of these indicators we use is the “SuperTrend” indicator.
Based on the SuperTrend indicator, it relies on price movements and volatility on the price. If we open this a little more: We can say that the price is based on the highest and lowest range and the degrees of fluctuations, however, the deviations on the price are taken into account, so that more accurate and sharper calculations can be made and sharper results can be obtained.
Although it may seem a bit complicated on the basis of the indicator, its use on the chart is equally easy for both novice traders and experienced traders. If there is an uptrend above the market, our indicator is located below the price and acts as support. If there is a downtrend on the market, our indicator sits above the price and acts as a resistance. When there is a very strong trend change on the market, our indicator crosses the initial value in the opposite direction and this shows us that the trend has changed. Besides: Since our indicator is a trend following indicator, it generally moves in the direction of the trend. However, in periods when the volatility on the market decreases, our indicator moves horizontally (flat). In short, we can say that changes on our indicator occur only in the direction of the trend.
We mentioned earlier that our indicator appeals to every trader. However, there is no such thing as a fixed or optimal setting of our indicator, each trader is determined by his own trading method or by the chosen time or market. For this reason, our indicator is a very popular indicator. This popularity shows us that our indicator is actually among the best known indicators.
The appearance and interpretation of our indicator on the chart is as follows:
- Color of Line (Red or Green)
- Line Direction Direction (Straight, Bearish, Bullish)
When these two factors are combined, the price movements on the market and the direction of the price can be easily interpreted.
- If we see a red line, it means that the trend on the market is Bearish. Likewise, if we see that the line on this red line moves straight, we can understand that the volatility has decreased.
- If we see a green line, it means that the trend on the market is Bullish. Likewise, if we see that the line under this green moves straight, we can understand that the volatility has decreased.
Super Trend Indicator Calculation
We mentioned earlier that the SuperTrend indicator is based on two parameters, period and factor. Now let's look at the calculation formula of our indicator.
- Up Trend (Upper Band) = (Higher + Lower) / 2 + factor x ATR (period)
- Downtrend (Upper band) = (Higher + Lower)/2 – factor x ATR (period)
It is in the form. If we refer to the ATR value in our formula:
- ATR = ((13 x Previous ATR) + Current TR)/14
In the above formula, 14 represents a period. Therefore, the ATR can be generated by simply multiplying the previous ATR by (13). Finally, we add the current TR and then divide by the period.
Question 2
What are the main parameters of the Supertrend indicator and How to configure them and is it advisable to change its default settings? (Screenshot required)
Main Parameters of SuperTrend Indicator
As we said before, SuperTrend consists of two parameters: Period and factor. Accepted as default setting: 10 periods for ATR and 3 for ATR multiplier.
Adding SuperTrend Indicator to Chart
In this section, I will use the Tradingview platform and show how to add the SuperTrend indicator to our chart through this platform.
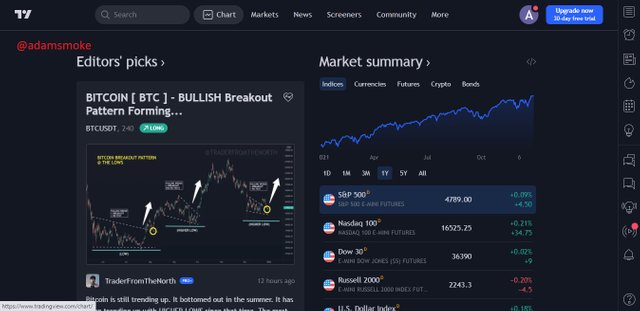
- First, we log in to the Tradingview platform. Then we click on the "Chart" section on the main page.
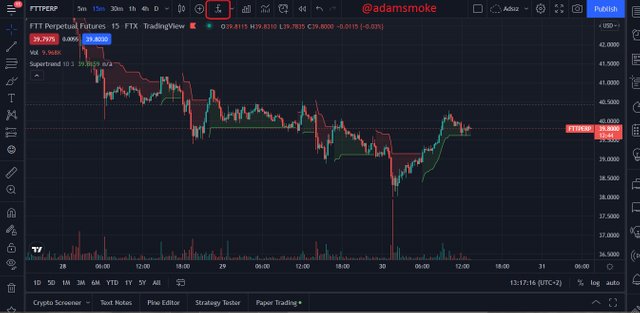
- Then we open the chart of an asset pair we want. Click on the "Indicators (Fx)" button on the graph that opens.
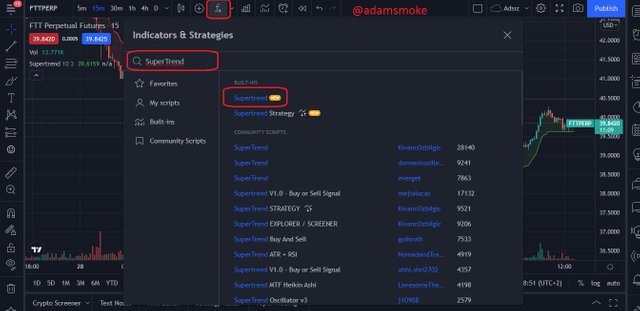
- Then we write “SuperTrend” in the search section from the menu that appears. Then, we successfully add our indicator by clicking once on the result.
Configuring SuperTrend Indicator
To configure our indicator, first:
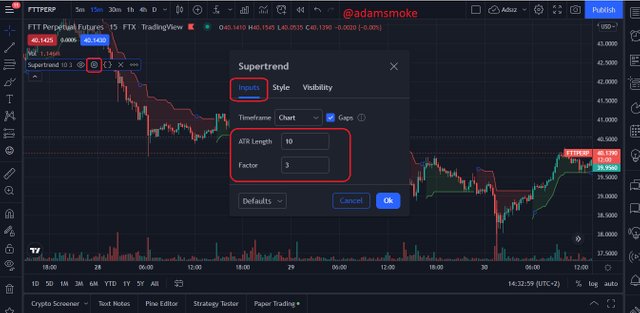
- Click on the "Settings" button on the indicator.
- Then, the "Inputs" section welcomes us first in the drop-down menu. In this section, our indicator has two changeable parameters. These are our “ATR Length” and “Factor” values. These values appear to us as "ATR Lenght = 10" and "Factor = 3" by default.
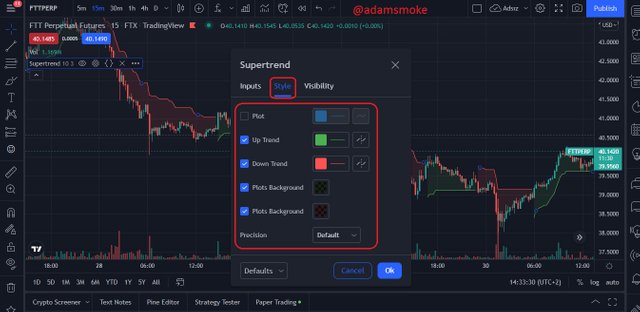
- Then we move on to another section, “Sytle”. In this section, we can say that there is a color menu and line settings menu that we can fully customize.
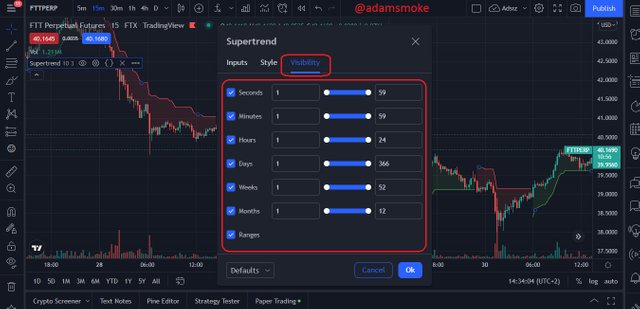
- Another part is "Visibility". In this section, there are time settings and it is not recommended to change them.
Is it recommended to change the default settings?
While many indicators are used with fixed parameter values, in many of them the parameters can be changed. Our SuperTrend indicator is an indicator that we can say a little bit more than that. In short, changing the default settings can be changed more depending on the trader, the way of trading and the market.
We said that the default settings can be changed according to the trader, the way of trading and the market. However, if the default settings are changed, there is no standard setting. For this reason, it would be more accurate to use the settings where we get the best and most accurate signals on the market. Because every change to be made on the default settings can increase or decrease the rate of giving us late/early or true/false signals.
In addition, when using the 10-3 parameters selected by default, analyzing 15-minute charts will give us more accurate results. This is generally preferred for intraday trades. For a longer form of trading: For example, for weekly trades, it would be more appropriate to use the parameter 10-4 and a 4-hour chart. I would like to show you this as a result of my own experience.
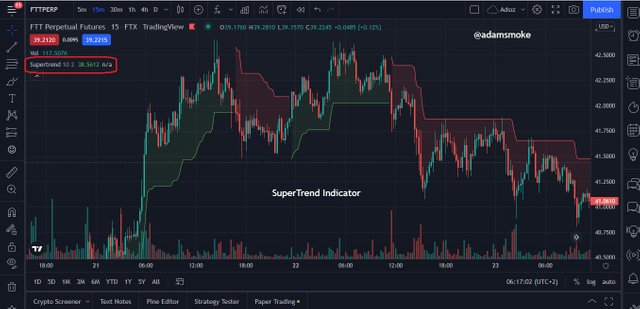
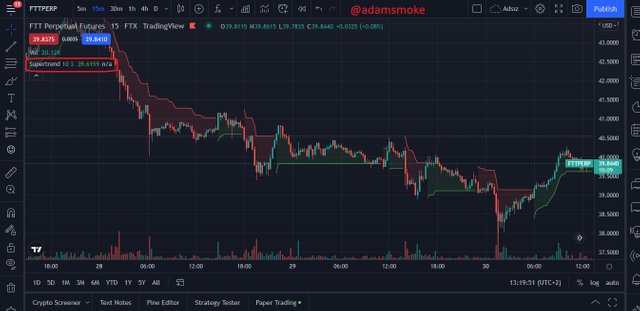
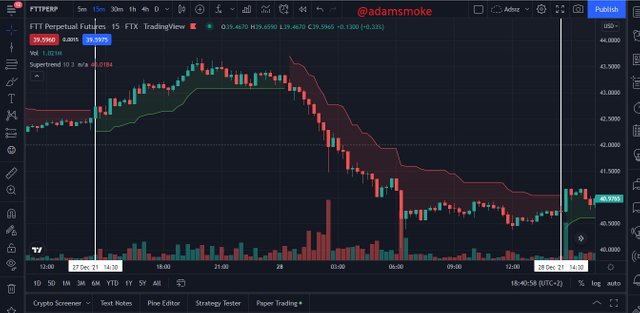
15-Minute FTT/USD Charts
10-3 Parameters
10-4 Parameters
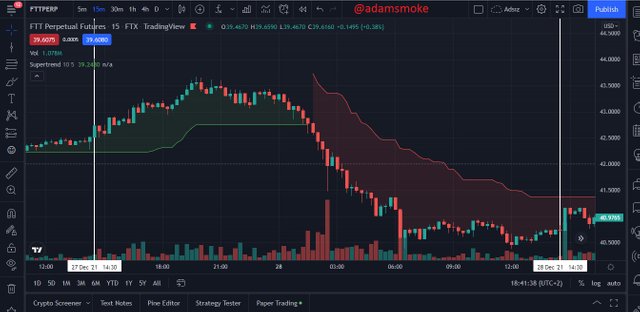
In the screenshot above, we have our SuperTrend indicator with parameters 10-3 and 10-5 in a 15-minute time frame between the same dates. When we look at the images more carefully, you can see that our indicator with 10-3 parameters moves closer to the price and reacts earlier, besides, our indicator is working correctly. However, our indicator with parameters 10-4 reacts further and later on the price, although we can see that it does not work correctly in some places.
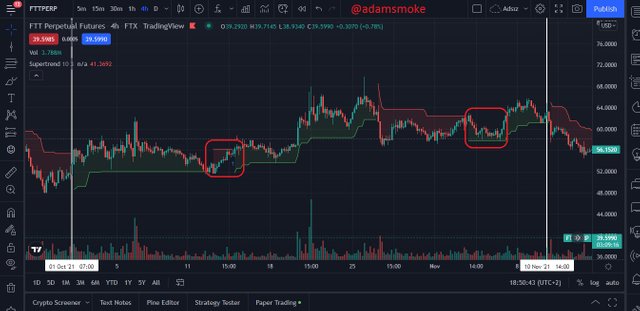
4-Hour FTT/USD Charts
10-3 Parameters
10-4 Parameters
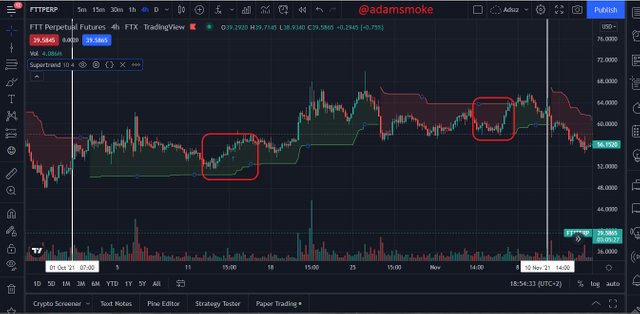
In the screenshots above, we have our SuperTrend indicator with parameters 10-3 and 10-5 in a 4-hour time frame between the same dates. When we look at the images more carefully, our indicator with 10-3 parameters again moves closer to the price and reacts earlier, but this time its price reactions produce false signals. In our indicator with 10-4 parameters, the price moves further and manages to produce more accurate signals.
Question 3
Based on the use of the SuperTend indicator, how can one predict whether the trend will be bullish or bearish (screenshot required)
Trend Setting with SuperTrend Indicator
As I mentioned earlier, the SuperTrend indicator is quite easy to use and understand. It is quite easy even for new traders to determine whether the market is Bullish or Bearish as it is a trend following indicator based on the SuperTrend indicator.
Bullish Trending with SuperTrend
If our SuperTrend indicator is moving below the price and its color is green, it indicates that the market is in a Bullish Trend. In addition, the angle of our indicator is also upwards. However, we should not forget that the price volatility on the market may decrease from time to time and our indicator may also move sideways in a straight line.
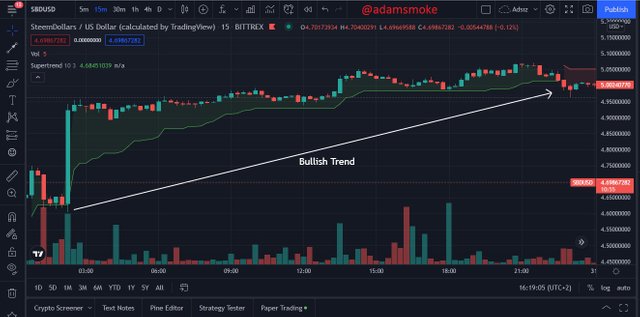
As we can see in the screenshot above, our Indicator is moving below the price and is green. Besides, the angle followed by our indicator is moving upwards.
Bearish Trending with SuperTrend
If our SuperTrend indicator is moving above the price and its color is red, it indicates that the market is in a Bearish Trend. Besides, the angle of our indicator is also downward. However, we should not forget that the price volatility on the market may decrease from time to time and our indicator may also move sideways in a straight line.
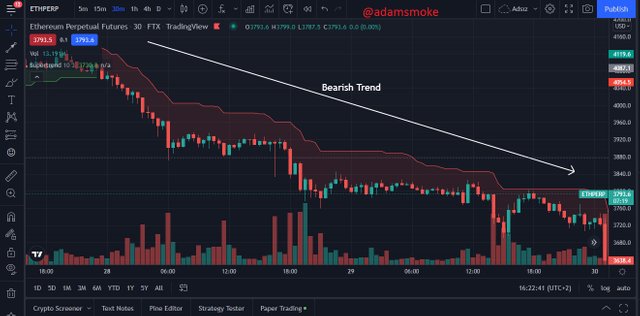
As we can see in the screenshot above, our Indicator is moving above the price and is colored red. Besides, the angle followed by our indicator moves downwards.
Question 4
Explain how the Supertrend indicator is also used to understand sell / buy signals, by analyzing its different movements.(screenshot required)
The SuperTrend indicator gives us many buy and sell signals on the market. In general, we can use buy and sell signals to open or close our position. For example, we open a “Buy” position when the market starts to rise and then close our position when the market starts to fall. Likewise, we open a “Sell” position when the market starts a downtrend and then close our position when the market starts to rise.
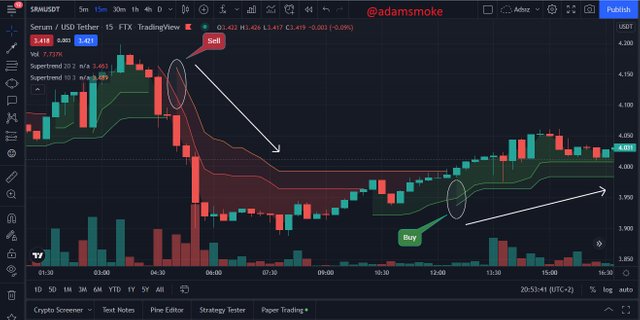
Buy Signal with SuperTrend Indicator
We usually place our buy position when a Bearish trend ends, ie when a Bullish trend begins. Buy signals with the SuperTrend indicator usually create a “Buy” signal for us when the indicator changes from red (when it is also moving above the price) to green (when it is also moving below the price).
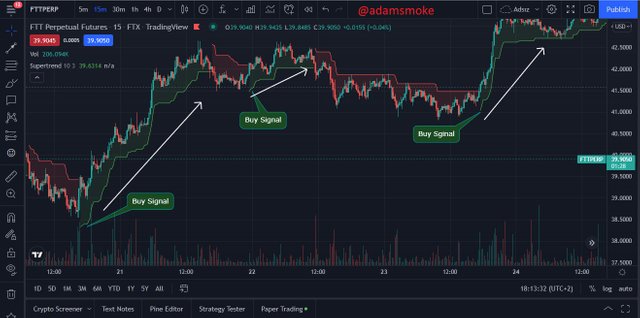
As you can see in the screenshot above, our Trend changes from Bearish to Bullish Trend, while our indicator turns from red to green in line with the trend. This is a “Buy” signal on the market for us.
Sell Signal with SuperTrend Indicator
We usually hold our sell position when a Bullish Trend ends, ie when a Bearish trend begins. Sell signals with the SuperTrend indicator usually create a “Sell” signal for us when the indicator changes from green (when it is also moving below the price) to red (when it is also moving above the price).
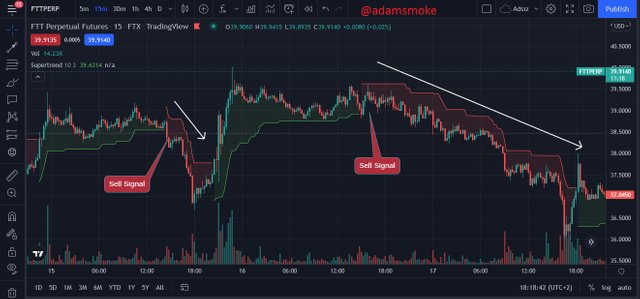
As you can see in the screenshot above, our Trend changes from a green color to a red color in line with the trend in our indicator as Bullish changes from trending to Bearish trending. This is a "Sell" signal on the market for us.
Question 5
How can we determine breakout points using Supertrend and Donchian Channel indicators? Explain this based on a clear examples. (Screenshot required))
SuperTrend and Donchian Channels
Donchain Channels are used alongside the SuperTrend indicator to determine Breakouts on the market. Because SuperTrend indicator is a trend following indicator. We can say that Donchain Channels is an overbought and oversold indicator created by the creation of the highest and lowest price averages in the 20-period period. In short, Donchain channels are channels that measure the reaction of prices in a way. Now let's see how to detect Breakouts using our SuperTrend indicator and Donchain channels.
Bullish Breakout
The first thing we have to do is wait for the end of a consolidated market. Next, the price needs to break the upper band of Donchain Channels two candles in a row. Meanwhile, our SuperTrend indicator should be Bullish Trend, this tells us that the market is in an uptrend. Then, when both cases occur, a Bullish Breakout occurs on the market and gives us a “Buy” signal.
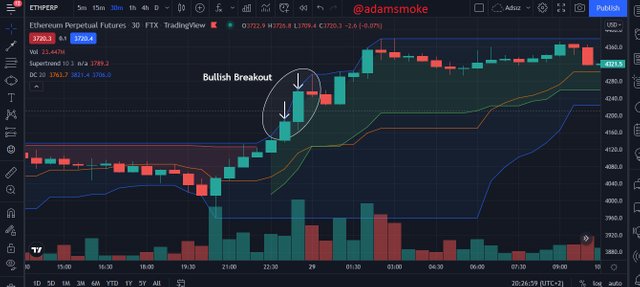
As you can see in the screenshot above: Price is breaking the upper band of our Donchain Channels indicator, two candles in a row. When this happens, we use our SuperTrend indicator as a filter and when we look at our SuperTrend indicator, we see that it is in Green (Bullish Trend). In this case, we confirm our Bullish Breakout setup and take our position as “Buy”.
Bearish Breakout
The first thing we should not do is wait for the end of a consolidated market. Next, the price needs to break the lower band of Donchain Channels two candles in a row. Meanwhile, our SuperTrend indicator should be Bearish Trend, this tells us that the market is in a downtrend. Then, when both cases occur, a Bearish Breakout occurs on the market and gives us the “Sell” Signal.
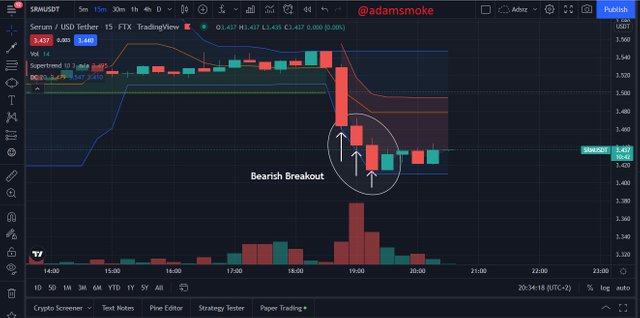
As you can see in the screenshot above: Price is breaking the lower band of our Donchain Channels indicator for three consecutive candles. When this happens, we use our SuperTrend indicator as a filter and when we look at our SuperTrend indicator, we see that it is in Red (Bearish Trend). In this case, we confirm our Bearish Breakout setup and take our v position as “Sell”.
Question 6
Do you see the effectiveness of combining two SuperTrend indicators (fast and slow) in crypto trading? Explain this based on a clear example. (Screenshot required))
SuperTrend (Fast) and SuperTrend (Slow)
We can confirm the signals given by the SuperTrend indicator with many other additional indicators. In addition, it is possible to filter or confirm the signals given by the SuperTrend indicator with a SuperTrend indicator. In this case, there will be settings of our two indicators that we need to pay attention to. One will be our slow SuperTrend indicator and we will use the default settings of 10-3, the other will be our fast SuperTrend indicator and have 21-2 settings.
What we need to do next is quite simple: we will have the same signals (buy/sell) that our two indicators (fast and slow) give. In short, when our fast curve crosses (goes above) our slower curve, both of our indicators turn green and this gives us a buy signal. Likewise, when our fast curve cuts down (below) our slow curve, both of our indicators turn red and this gives us a sell signal.
Question 7
Is there a need to pair another indicator to make this indicator work better as a filter and help get rid of false signals? Use a graphic to support your answer. (screenshot required)
Not every indicator works 100% correctly. For this reason, it is necessary to use additional indicators to confirm or filter each indicator. As with all other indicators, this applies to the SuperTrend indicator. Therefore, in this section, I will combine our SuperTrend indicator with the RSI indicator. But the point to be noted is that not every indicator works correctly in a pair. For this reason, since our SuperTrend indicator is a trend follower indicator, I will use it together with the RSI indicator, where we can clearly see overbought and oversold on the market.
Common Use of SuperTrend and RSI Indicators
If we talk about the RSI indicator briefly: It has a scale between 0-100 values. When our RSI indicator generally drops below 30, it tells us that the market is oversold. When it goes above 70, it says that there is an overbought on the market.
The common usage of our two indicators is as follows: Our RSI indicator gives oversold and overbought signals. If our RSI indicator is in the oversold zone, we call our position "Buy". If our RSI indicator is in the overbought region, we call our position “Sell”.
Then we use our SuperTrend indicator to confirm the signals we have received from our RSI indicator. If our RSI indicator gives us a “Buy” signal: when our SuperTrend indicator turns from red (downtrend) to green (uptrend), our “Buy” setup takes place and we take our Buy position. If our RSI indicator is giving us a “Sell” signal: When our SuperTrend indicator turns from green (uptrend) to red (below) our “Sell” setup takes place and we take our Sell position.
Buy Position
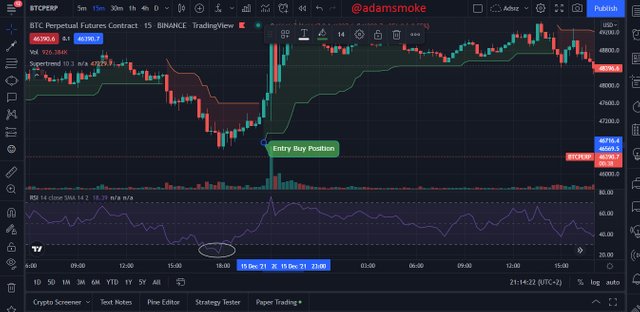
Sell Position
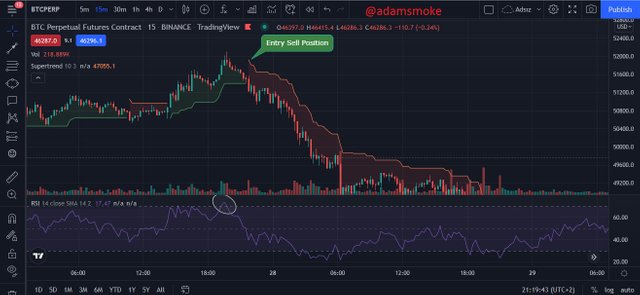
As you can see in the screenshot above, our RSI indicator goes above 70 and starts to fall again. This gives us a sell signal over the market. Then, when we look at our SuperTrend indicator, it turns red after a little delay and informs us that a downtrend has started on this market. As soon as these two situations occur, we take our position as “Sell”.
Question 8
List the advantages and disadvantages of the Supertrend indicator:
Advantages of SuperTrend Indicator
- The indicator literally allows us to clearly see the trends on the market.
- Signals received with the help of additional indicators can be filtered and allow us to trade more accurately.
- The indicator is very useful for both beginners and experienced traders due to its simple use.
Disadvantages of SuperTrend Indicator
- When used alone, false signals can be difficult to identify.
- May not produce accurate signals in a consolidated market.
- It may not work correctly in cases where price volatility is low.
Conclusion
We have touched on many topics about the SuperTrend indicator in this post. How to identify trends, use with additional indicators, etc. I think that I have explained and learned topics such as. When we look at the indicator in general, it is an indicator that appeals to all traders and it is a very useful indicator.
I would like to thank professor @kouba01 for this nice lesson and everyone who has read my post so far. I wish you all a healthy and beautiful new year.
CC: @kouba01