Crypto Trading With Rate Of Change (ROC) Indicator | Crypto Academy Season 4 Week 8 | Homework post for @kouba01
Introduction
Hello to everyone,
In this post, I will work on the lecture given by professor @kouba01. The topic covered in this week's lecture by the professor is “Crypto Trading With Rate of Change (ROC) Indicator”. Thank you to everyone who reads my post. Let's do it!

Question 1
In your own words, give an explanation of the ROC indicator with an example of how to calculate its value?And comment on the result obtained.
Rate of Change (ROC)
As we can understand from its name, the Rate of Change indicator is a technical analysis tool that shows us the changes made by the price as a percentage. In its most general definition, the ROC indicator is: It is a momentum-based technical indicator that measures the percentage change between the current price and the price N periods ago.
Thanks to the ROC indicator, we can easily learn the trend direction, trend strength or trend reversal on the market. Many indicators can be difficult or complex for novice traders to understand. However, the ROC indicator is one of the easiest to read and understand for both experienced and inexperienced traders.
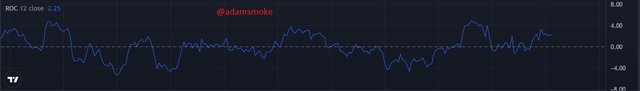
As we can see in the screenshot above, on the ROC indicator:
- There is a positive side and a negative side. This positive and negative side refers to the % values above and below the 0% line, which is considered the midpoint of the indicator.
- When the ROC indicator is above 0%, it indicates that there is a price increase on the market, that the market is in an uptrend, and the indicator value is positive.
- When the ROC indicator drops below 0%, it indicates that there is a price on the market, the market is in a downtrend, and the indicator value is negative.
In addition to these features, the ROC indicator also informs that the price is in the Overbought or Oversold regions. In addition, it allows us to determine market movements such as Crossover, Continuation, divergence. In this way, we, the traders, prevent us from making wrong transactions such as selling low or buying high when entering or exiting our trade. We will discuss these issues in more detail in the following sections.
Calculation of Rate of Change (ROC) Indicator
We learned what the ROC indicator is and how we can read it. Now let's examine the mathematical formula used while creating the ROC indicator.
- ROC = [(Current Price – Price of N periods back) / Price of N periods back]x100
We can understand this calculation more easily with an example. E.g; Let's consider an asset with an instant price of 100 USD. Let the price of this asset 12 periods ago be 95 USD. Let's calculate the ROC of this asset.
- ROC = [($100 – $95)/ $95] x 100
- ROC = 5.2631
Let's calculate this example on a real graph now.
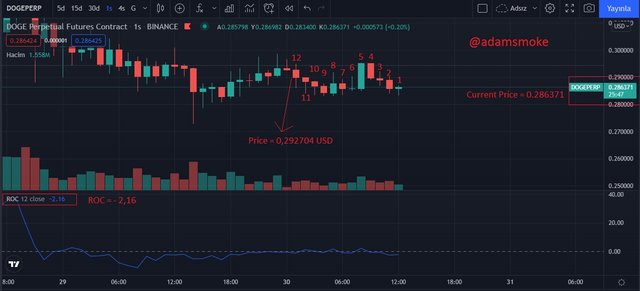
Now let's do this calculation again for the example above using our formula.
- ROC= [(0.286371 USD – 0.292704 USD)/ 0.292704]x100
- ROC = - 2.1636
As we can see, our calculations above and our values in the screen shot coincide with each other.
Question 2
Demonstrate how to add the indicator to the chart on a platform other than the tradingview, highlighting how to modify the settings of the period(best setting).(screenshot required)
Adding ROC Indicator to Charts on FTX Platform
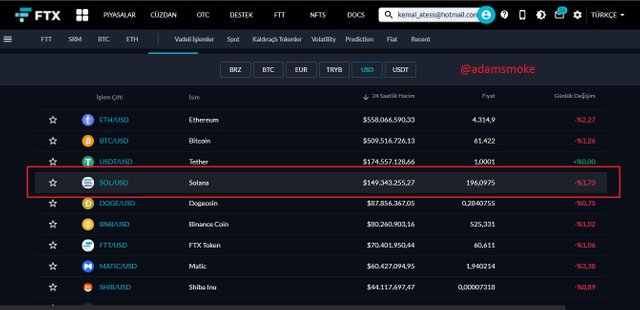
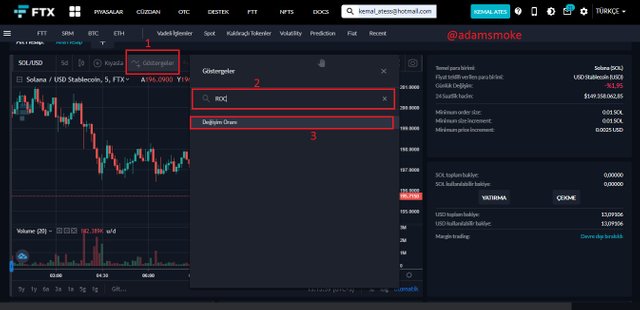
- First we go to the FTX platform.
- Then we click on the markets section on the screen that appears. From here, we choose the asset pair to trade. Here I select the SOL/USD pair and click on it.
- On the next screen, we click on the Indicators section at the top of the graph.
- In the menu that opens, we write ROC in the search section and select the result by clicking on it.
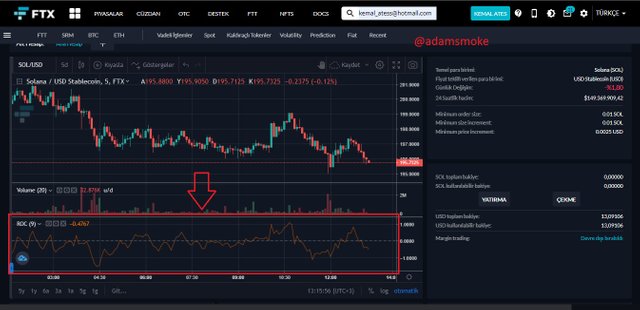
- Our indicator has been successfully added to our chart.
Configuration and Optimal Settings of ROC Indicator
The ROC indicator works in harmony with many trading strategies. Therefore, it is possible to use shorter periods in short-term trading strategies and longer periods in long-term trading strategies.
When we first add the ROC indicator to our chart, it is added by default with a 9-period setting. However, it would not be correct to use the 9-period setting in every trading method. Because the period settings of each trading method are different and if we do not use these settings correctly, our rate of getting false signals will increase.
It would be a more accurate setting to determine the best setting of the ROC indicator, which is generally used in period settings such as 9,12,14,25, according to our trading style. For example, for a short-term trader, the 9-period period setting is a good choice, while for a long-term trader, this setting may produce false signals. It is therefore recommended to use settings with longer periods.
Now let's see how we can edit the configuration settings of the ROC indicator that we have added to our chart.
- First of all, there is a settings section in the upper left corner of our indicator located at the bottom of our chart. When we click on this section, we reach the configuration settings.
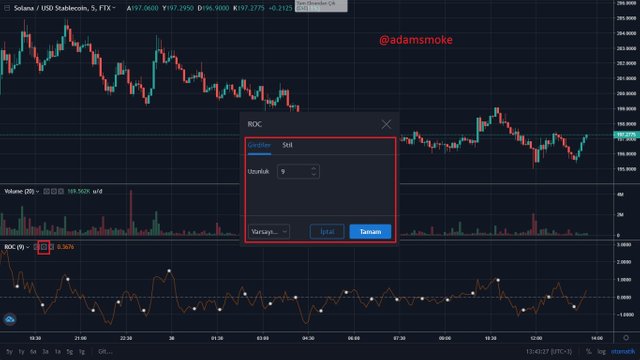
As you can see in the screenshot above, when we click on the settings section, a drop-down menu appears. In this menu, we first see the “Inputs” section. In this section, we can set the length of our indicator. E.g; We can change the length settings such as 9,12,14,25 from this section.
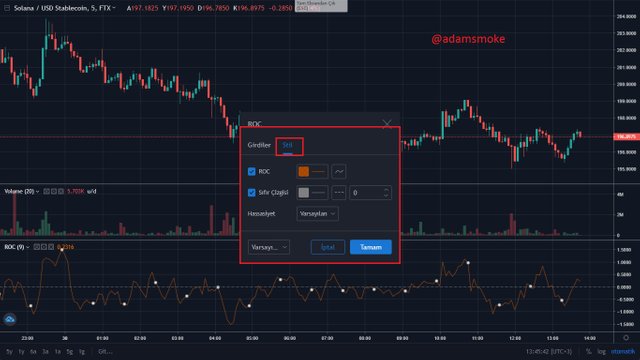
Another option in the menu that appears, as we can see in the screenshot above, is the "Style" section. This section contains the configuration setting of the “Zero line” and “ROC line” lines on the ROC indicator. From here we can easily customize the appearance styles and colors of the lines.
Question 3
What is the ROC trend confirmation strategy? And what are the signals that detect a trend reversal? (Screenshot required)
As we mentioned earlier, the ROC indicator provides many signals and conveniences for traders. The most important of these is Trend detection and the detection of the reversal of the Trend. Now let's see how to detect and confirm them on the chart.
1. Trend Confirmation
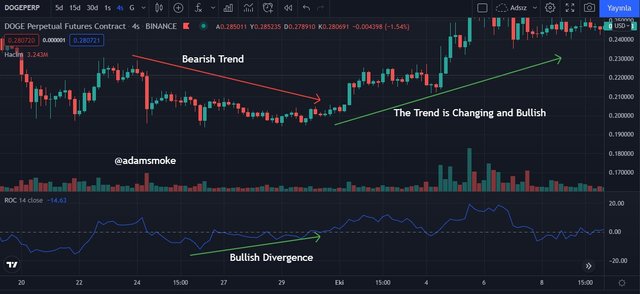
As we mentioned earlier, when the value of the ROC indicator falls below or exceeds 0%, it informs us about the trend. When the ROC line crosses the 0 line from bottom to top, that is, when it moves to the positive direction, it informs us that the uptrend has started. Thanks to this intersection, we confirm the uptrend. Likewise, when the ROC line crosses the 0 line from top to bottom, that is, when it crosses into the negative direction, it informs us that the downtrend has started. Thanks to this intersection, we confirm the downtrend. We can see this more clearly on a graph.
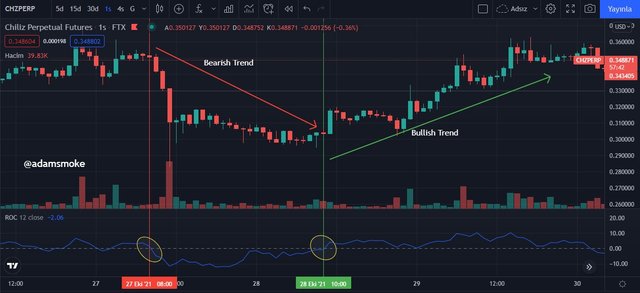
As we can see in the screenshot above, the Bullish and Bearish trends on the price are clearly visible. When we look at our ROC indicator, the direction of its trends became clear after the intersections.
2. Signal of Trend Reversal
As we said before, the ROC indicator gives us signals both in determining the trend direction and determining that the trend will change. The intersection of the ROC line and the centerline (Zero line) gives us confirmation that a trend has changed. This intersection event is called Crossover. Let's examine this situation again on our previous example.
When we look carefully at the ROC indicator in the screenshot above; We can see that the ROC line cuts down the centerline, initiating a Bearish Trend. Then, after this intersection, another cut takes place and; The ROC line crosses the centerline upwards and then an uptrend begins. So, as we can understand, the “Crossover” points on the ROC indicator give us the signals that the current trend will reverse.
Question 4
What is the indicator's role in determining buy and sell decicions and identifying signals of overbought and oversold؟(screenshot required)
Overbought and Oversold signals are a set of positions that we traders use when the price moves on the market without a specific trend or when the ups and downs follow each other at the same level.
In the ROC indicator, on the other hand, these overbought and oversold points are determined when the indicator crosses a 3% or 4% spread. When the price reaches these levels, it is not recommended to take a position, regardless of negative or positive territory.
The Oversold and Overbought zones in the ROC indicator are generally used to place a buy or sell order. E.g; Suppose the ROC line crosses the centerline downwards and upwards. This gives us a buy signal. Then the spread rate reaches 4% and starts falling back, at which point the price has reached the Overbought zone and will start to fall back. What we will do at this moment is to sell our assets. Now I am sure we will understand this better on an example.
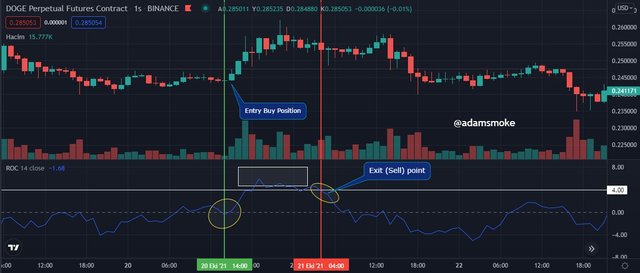
As we can see in the screenshot above;
- When the ROC line crosses the 0 line upwards it gives us a buy signal and we take our position as Buy.
- Then the price starts to rise and reaches the Overbought level. Since we have determined our spread area to be 4%, we execute our Sell as soon as the price starts to drop below this level.
The same is true for the Buy position.
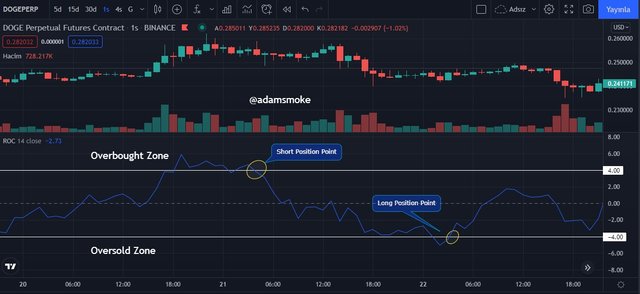
Another applicable futures trading strategy is; Let's say the market is in an uptrend. The price is moving in the overbought zone and is starting to drop below the 4% spread area we set. This gives us signals that the price will go down. As shown in the screenshot above, if we did not take a position when the ROC indicator crosses the center line, we can take our position as "Short" when the ROC line crosses the 4% spread line that we have determined. In this way, we increase our profit rate. The same is true when the price leaves the Oversold region. If the ROC line goes above the spread area we have determined, we can take our position as "Long". You can see this more clearly in the screenshot below.
Question 5
How to trade with divergence between the ROC and the price line? Does this trading strategy produce false signals?(screenshot required)
Since the ROC indicator is an oscillator, it generally moves in the same direction as the price. However, just like other oscillators (RSI, etc.), they sometimes do not move in the same direction as the price. We call this Divergence. This divergence signals that the trend is weakening and likely to reverse. We call these divergences Bearish Divergence and Bullish Divergence.
1. Bearish Divergence
When the trend on the market is Bullish, the price is bullish, but the ROC indicator shows a downtrend and we call it Bearish Divergence.
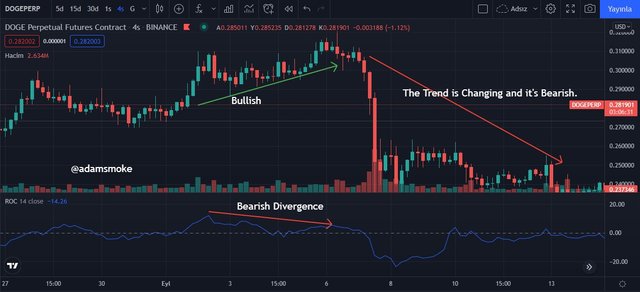
As we can see in the screenshot above, the ROC indicator goes down as the price goes up. We call this situation Bearish divergence and we can understand that the market will start a bearish divergence.
2. Bullish Divergence
When the trend on the market is Bearish, the price is bearish, but the ROC indicator shows an uptrend and we call it Bullish Divergence.
As we can see in the screenshot above, the ROC indicator is rising while the price is falling. In this case, we think that the trend of the market is weakening and will change. Then the trend of the market changes and goes up.
3. Trend Divergence False Signals
The divergence between the price and our indicator does not always cause a trend change. As we said before, the trend may weaken, but the trend may continue without changing direction later on. When there is no trend change on the market, we consider it a false signal.
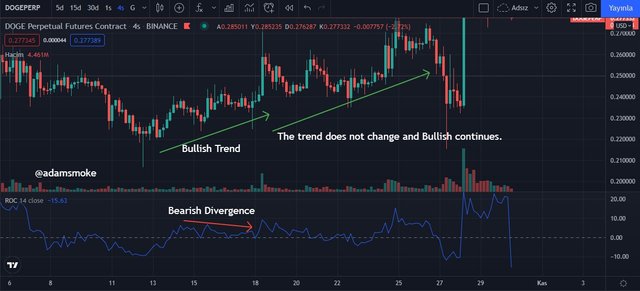
As you can see in the screenshot above, a Bearish Divergence is occurring on our indicator. But then the trend does not change and the market continues its uptrend. This was an example of a false signal. Almost any indicator can give such false signals because no indicator works 100% correctly. Therefore, it is always better to use additional indicators to filter out such false signals.
Question 6
How to Identify and Confirm Breakouts using ROC indicator?(screenshot required)
Breakout, as we all know, means a sudden break in a predetermined support or resistance level. A breakout is a sudden fall or rise in price, usually when the trend weakens or moves sideways on the market. Our ROC indicator can be used to determine these Breakouts points.
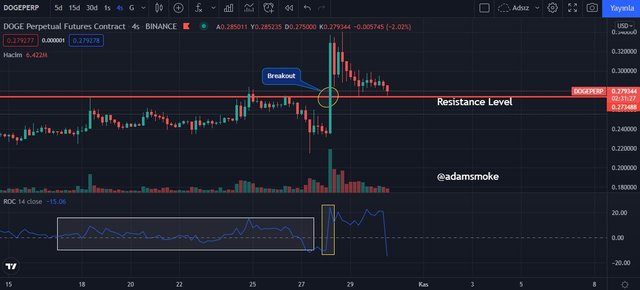
As you can see in the screenshot above, there is a resistance level that we have identified on the price and the price is breaking this resistance level. When we look at the ROC indicator at the same time, it is possible to see a sudden rise. During this uptrend, we can see that the ROC line cuts upwards from the centerline and makes a sudden uptrend. In other words, the ROC indicator correctly confirmed our breakout level on the price.
Question 7
Review the chart of any crypto pair and present the various signals giving by ROC trading strategy. (Screenshot required)
XRP/USD Pair
In this section, I will share with you the signals I received using the ROC indicator on the XRP/USD chart. While doing this analysis, I will use the XRP/USD pair 4-hour Chart and use the ROC indicator for the 14-day period.
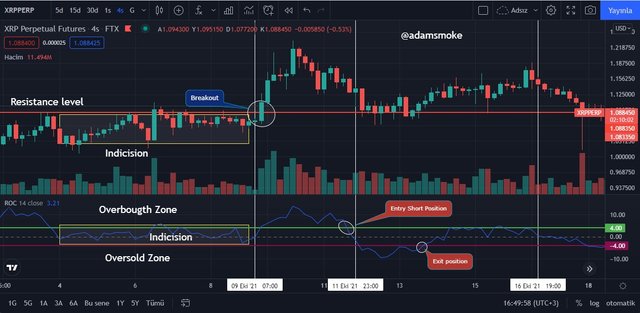
As we can see in the screenshot above; the market is moving in a phase of indecision. Then, the price breaks a resistance level that we have determined on the price. We can also see this breakdown in the ROC indicator. Our ROC line crosses our centerline upwards and is making a spike.
Then, when we look at the overbought and oversold levels that I have determined with the 4% spread area, we can see that the price has quickly risen to the overbought level. Then, the price goes out of our overbought region. This signals us to open a "Short" position. Then, the price decreases and enters our oversold region. This signals that the asset is oversold and the price has reached sell saturation. After this point, we predict that the price will go up and when the price goes out of the oversold region, we can either close our position or take a “long” position. At the same time, if we pay attention to the areas where the vertical lines we have drawn intersect on the ROC indicator: We can see that the trend starts a downtrend when the ROC line crosses the centerline downwards and starts an uptrend when it crosses the upwards.
Conclusion
The ROC indicator is an indicator that gives accurate signals when the correct period lengths are selected in every time frame, as we have mentioned before. According to most indicators or technical analysis tools, it is a fairly simple indicator to read and understand. However, we should not forget during our trades that no indicator works 100% correctly. That's why we always use an additional indicator next to it, allowing us to get more accurate buy or sell signals.
Thanks again to professor @kouba01 for this lesson and to everyone who read my post. I wish you all a healthy and beautiful day.
Cc: @kouba01

Hello @adamsmoke,
Thank you for participating in the 8th Week Crypto Course in its 4th season and for your efforts to complete the suggested tasks, you deserve a Total|7.5/10 rating, according to the following scale:
My review :
A good article in which you were able to answer most of the questions ably, and you have some notes that I made.
As for the sixth question, you did not go into depth in determining breakout point using the indicator.
In the last question it was possible to extract several other signals.
Thanks again for your effort, and we look forward to reading your next work.
Sincerely,@kouba01