[Crypto Trading With Linear Regression Indicator]- Crypto Academy /S5W5-Homework Post for @kouba01
Hello everyone,
In this post, there are the assignments of professor @kouba01 in this week's lesson. The subject of our sharing is "Linear Regression Indicator". It is an indicator that is generally easy to use and understand. Without further ado, I would like to start my sharing.

Discuss your understanding of the principle of linear regression and its use as a trading indicator and show how it is calculated?
Linear Regression
Before we talk about what linear regression means, we need to know what "regression" means.
Regression: Allows us to determine the relationship between a dependent variable and one or more independent variables. Regression analysis, on the other hand, allows us to understand how the dependent variable changes when some of the independent variables change.
Linear correlation and simple linear regression is a statistical method that examines the relationship between two variables linearly. Correlation shows how much of a relationship there is between two variables. Linear Regression, on the other hand, is based on the relationship between two variables and involves creating an equation (model) to predict the value of one from the other.
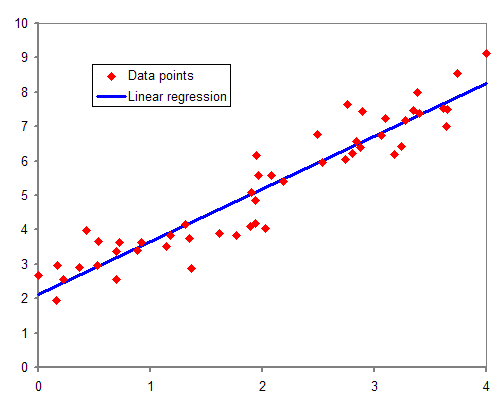
In short Linear regression is used to find the best fit straight line for a set of points or data. To define it in another way: Linear regression establishes a relationship between the dependent variable (Y) and one or more independent variables (X) by using the most appropriate straight line (regression line).
As we can see in the screenshot below, the red line is called the optimal straight line.
Linear Regression Indicator
The Linear Regression indicator is an indicator created by following the linear regression model. However, the variables used in this indicator appear as “time and price”. Thanks to this indicator, many traders identify entry and exit points during their trades. In addition, it is used to determine trends and trend reversals on the market.
The use of this indicator is used like a moving average due to its similarity. However, our indicator has less lag than the moving average and produces more accurate signals. The buy/sell signals generated during our trades emerge after the linear regression line and price movements intersect.
Calculation of Linear Regression Indicator
The formula for the straight line in our Linear Regression indicator is Y = a+bx. Let's examine our formula in more detail:
y = price
x = date
a = constant value (value when x equals zero)
b = slope of the line
is in the form. The calculation of this appropriate line is as follows.b = ( nΣxy - ΣxΣy) / ( nΣx² - (Σx)²)
a = ( Σy - bΣx ) / n
The “n” value in the above formulas represents the selected period length.
Show how to add the indicator to the graph, How to configure the linear regression indicator and is it advisable to change its default settings? (Screenshot required)
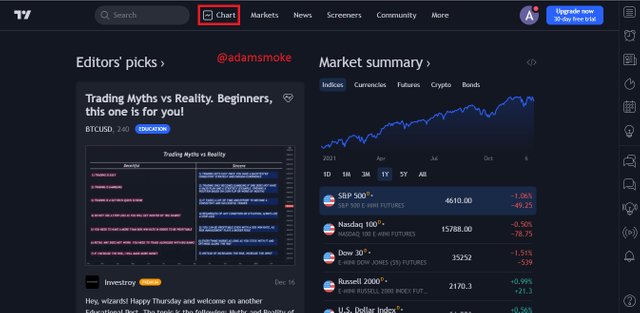
In this section I will use the platform Tradingview to add the indicator to the chart. First, we visit the Tradingview platform and click on the “Chart” section on the main page. Then we open the graph of the asset pair we want. Then in order:
- We press the "Indicators (fx)" button at the top of our chart.
- In the menu that opens, we write "Linear Regression Formula" in the search section and when we click on the result, we add our indicator.
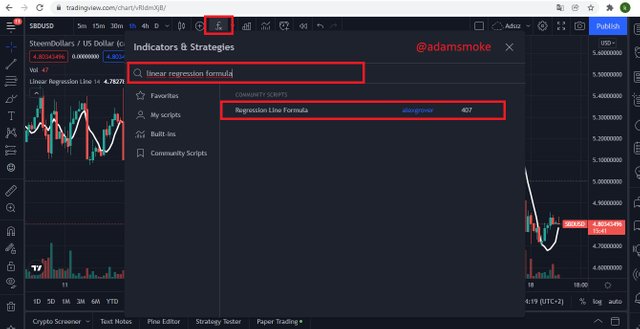
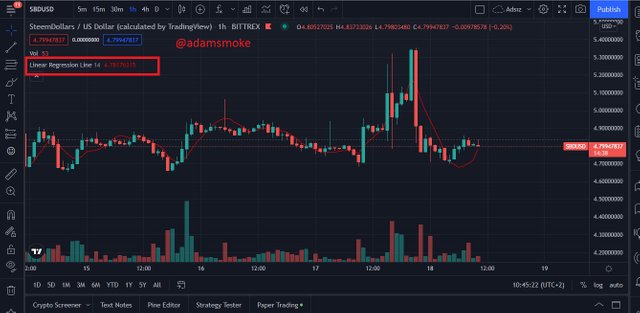
As you can see in the screenshot above, our indicator has been successfully added to our chart with the SBD/USD pair.
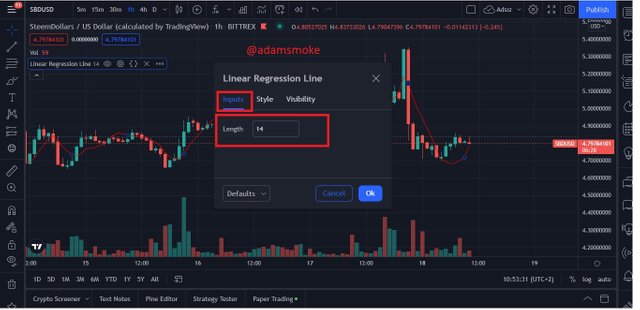
We have successfully added our indicator. Then, when we want to configure our indicator, we click on the "settings" button on our indicator. Then, three different sections welcome us in the drop-down menu.
Input: In this section, there is the period length setting of our indicator. 14 period lengths set as standard welcomes us.
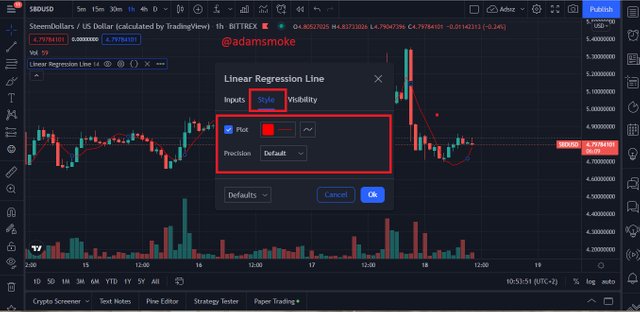
Style: In this section, there are the customization settings of our Linear Regression Line on our indicator. Settings that we can customize such as color, line thickness.
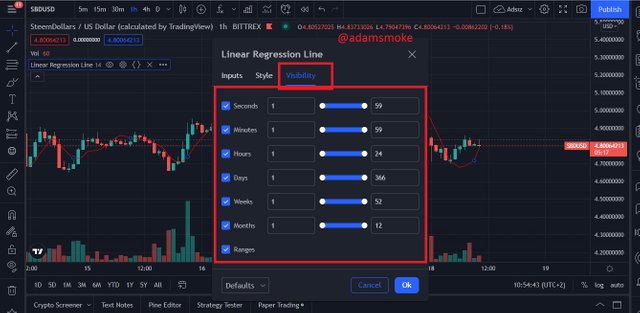
Visibility: Time settings are available in this section.
Changing Default Settings
When we add our indicator to our chart, it comes with its standard setting of 14 period length settings. This setting is the standard setting of our display and is not recommended to be changed. Because although this indicator has similar features with the moving average, it is better than the moving averages in terms of the signals it produces and the delay time. These 14 period lengths can be changed optionally. However, this will have negative consequences. For example, if we had used an indicator with a length of 66 periods, there would have been serious delays in the buy/sell signals given by our indicator, and these delays would have caused us to open wrong positions in our trade. For this reason, it would be more accurate to use the standard setting of 14 period lengths for the correct entry/exit points to make better use of our indicator. We can see this more clearly with an example.
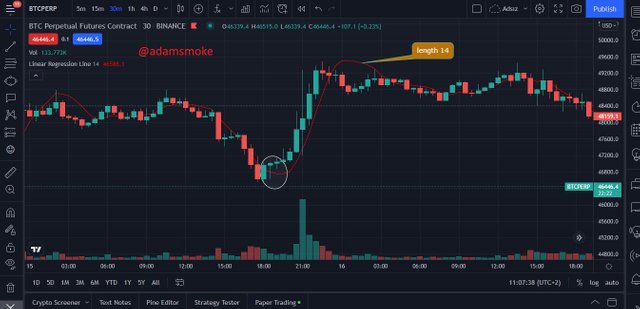
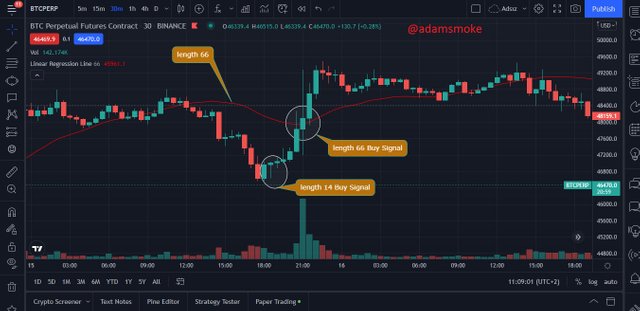
The above screenshot shows the BTC/USD pair. As you can see in our first picture, one of our indicators with a length of 14 periods shows the point where we get a Buy signal. Then when I change the length setting to 66, our indicator line diverges more from the price and produces the Buy signal later.
How does this indicator allow us to highlight the direction of a trend and identify any signs of a change in the trend itself? (Screenshot required)
Identifying Trend Direction
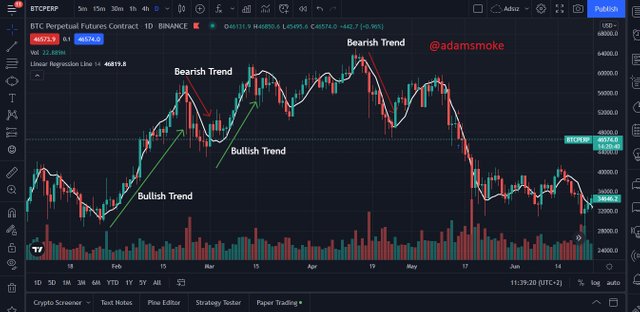
As we said before, the Linear Regression Indicator (LRI) is an indicator that is very easy to read and interpret, and is similar to moving averages in many ways. To determine the direction of a trend with LRI: It will be enough to look at the movements of our price and LRI line. For example: If our LRI line is moving below the price, it is a Bullish indicator. Likewise, if our LRI line is moving above the price, it is a Bearish indicator. We can see this more clearly with an example.
Identifying Trend Change
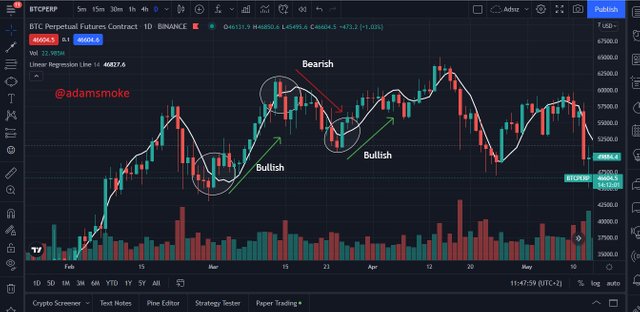
In order to determine the Trend Change, the movements of the price and the LRI line are followed. For example: let's say our LRI line is moving in an uptrend and is moving below the price. Our LRI line and price start converging as the trend starts to run out. Then an intersection occurs. This shows us that the trend has changed. If price crosses our LRI line downwards: we know that an uptrend has turned into a downtrend. Likewise, if price crosses our LRI line upwards: we know that a downtrend has turned into an uptrend.
Based on the use of price crossing strategy with the indicator, how can one predict whether the trend will be bullish or bearish (screenshot required)
Price Crossing Linear Regression Line Strategy
Price Crossing strategy is essentially the same as what we described in the previous section. In the previous section, we talked about the moment when the trend weakened and the intersection that took place afterwards. Likewise, in the Price Crossing Linear Regression Line strategy:
It is nothing but the intersection between the price and our LRI line, which we call the “Cut”. At this point, the determination of trends is as follows:
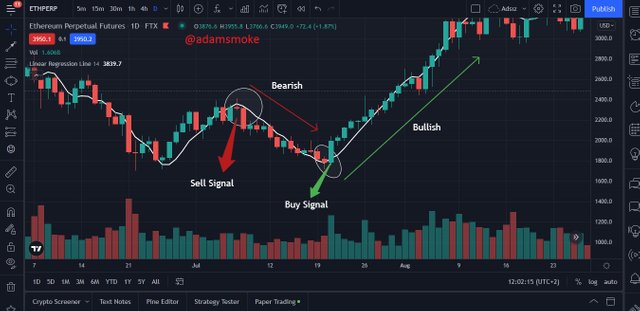
- If the price is crossing our LRI line from the top down, it indicates the start of a downtrend and gives us a “Sell” signal.
- If the price is crossing our LRI line from the bottom up, it indicates the start of an uptrend and gives us a “Buy” signal.
Explain how the moving average indicator helps strengthen the signals determined by the linear regression indicator. (screenshot required)
We have said before that our Linear Regression indicator shows the same similar characteristics as the moving average. Again, the buy/sell signals given by the LRI and the Moving average are similar. However, since the LRI moves closer and more parallel to the price, it gives more signals than the moving average, and at this rate, it gives more false signals. We can filter and strengthen these signals with the help of moving average.
The movements of the moving average and LRI line are considered as a pair and the signals are strengthened by taking trade positions according to the buy/sell signals they give at the same time. Many traders make their entry and exit points with this double signal. Now let's see how these signals are and how they are interpreted:
- If the moving average moves below the LRI line and the price, it indicates that the market is in an uptrend. In addition, when the price goes above both the LRI line and the moving average, it can be interpreted as a "Buy" signal.
- If the moving average moves above the LRI line and the price, it indicates that the market is in a downtrend. In addition, when the price falls below both the LRI line and the moving average, it can be interpreted as a "Sell" signal.
We can understand these definitions more clearly and easily with a visual.
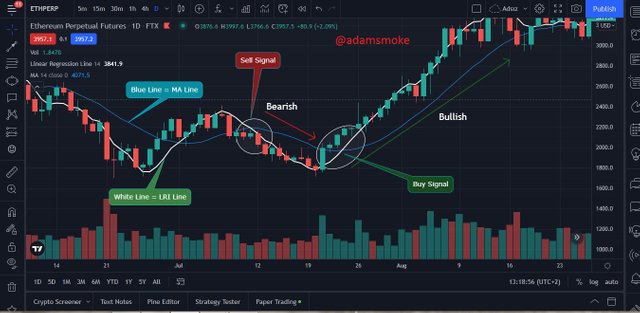
As you can see in the screenshot above, there is a graph of the ETH/USD pair. Again in this chart, the points where buy/sell signals are taken are shown with the help of both LRI and MA indicators.
Do you see the effectiveness of using the linear regression indicator in the style of CFD trading? Show the main differences between this indicator and the TSF indicator (screenshot required)
The use of the Linear Regression Indicator is a very effective indicator for determining the trend direction and is very suitable for trading CFDs. The CFD trading method is generally preferred by traders who make short-term transactions. While there are many similarities between the TSF indicator and the LRI, traders trading CFDs generally prefer to use the TSF indicator. The TSF indicator is also very useful in determining the trend and direction of the trend using the average price action. The most important feature that distinguishes our TSF indicator from LRI is that it is more sensitive to price movements and responds more quickly. For this reason, traders prefer to use TSF for their short-term trades, while LRI is more suitable for medium and long-term trades. But besides that, their movements in general are quite similar to each other.
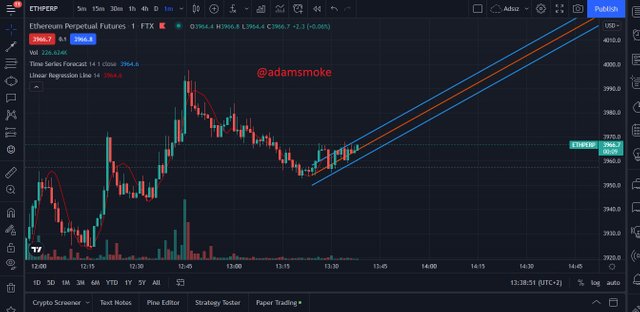
Besides all these, another feature that distinguishes these two indicators from each other is: As you can see in the screenshot below, the TSF indicator adds three slashes to the end of the graph. Thanks to these lines, we can easily predict the direction the trend will move.
List the advantages and disadvantages of the linear regression indicator:
Advantages of Linear Regression Indicator
- It has a simple, easily understandable and easily interpretable usage.
- It can be used safely in our medium and long-term trades.
- It allows us to easily predict trends, breakouts and trend changes on the market.
- It gives faster responses than the moving average.
Disadvantages of Linear Regression Indicator
- The rate of giving false signals in our short-term transactions is high.
- Like all indicators, it does not work 100% correctly and requires assistance from additional indicators during our transactions.
- Its use in highly volatile markets may not yield accurate results.
Conclusion
In this post, we discussed the Linear Regression Indicator, which is an indicator that both experienced traders and beginner traders can easily use. We saw that the basis of LRI is actually based on the Linear Regression method, as we can understand from its name. We have seen that with the correct use of LRI, it can actually give pretty good buy and sell signals. I hope we can use it properly in our trades and get nice profits.
Thank you to everyone who read my post and to professor @kouba01 for this lesson. I wish everyone a healthy and beautiful day.
CC: @kouba01