Crypto Academy Season 3 | Intermediate Course | Homework Post for @asaj - Crypto Assets and the Random Index (KDJ)
Introduction
Hello All,
This week, there were many beautiful lessons at cryptoacademy. In this post, I will fulfill the duties of professor @asaj.
Our main topic in this post is the KDJ indicator. This indicator is also known as Random Index. The professor explained the basic elements of this indicator beautifully to us in his lecture.
Thank you to everyone who reads my post. Also, thank you to the professor for this nice lesson. I wish you all a healthy and beautiful day.
Now we can start our tasks.

Question 1
In your own words define the random index and explain how it is calculated
The KDJ indicator is a fairly new and at the same time very practical technical analysis indicator. Although it was first used in futures market analysis, it was later used frequently in short-term trend analysis.
KDJ indicator; It is an indicator that combines the advantages of momentum, strength index and moving averages. The KDJ indicator gives us information on identifying trends and when to enter/exit a trade. This is why the KDJ indicator is a useful and important indicator for traders.
KDJ indicator; It works like stochastic, but because it is slow, it can sometimes be late in signaling. For this reason, it is useful to use an additional indicator when using the KDJ indicator.
The KDJ indicator works based on a specific period and records the highest price, lowest price and closing price of the asset during the period and its calculation is based on these values.
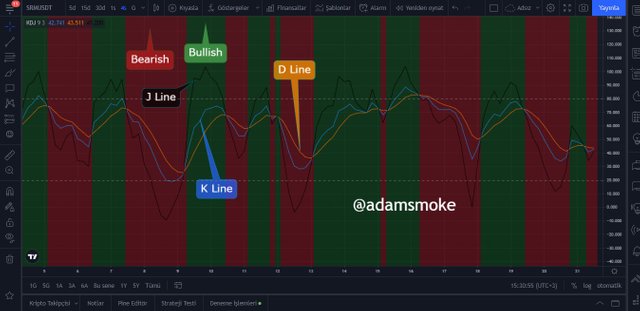
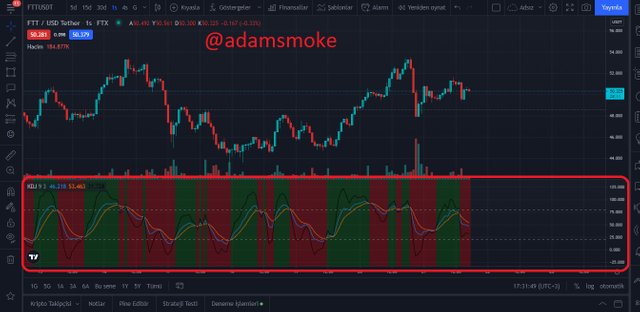
- The KDJ indicator appears in the screenshot above.
As we can see in the screenshot, the KDJ indicator consists of 3 lines. These; K line (Blue), D line (Orange) and J line (Black). In addition, as you can see in the screenshot, the green (uptrend) and red (decrease) colors give us information about the direction of the trend and allow us to see the trend easily.
The KDJ indicator has values between 0-100. There are also two horizontal lines on the indicator with values of 20 and 80. When the indicator moves above or below these values, it indicates that the trend has changed.
- 80 and above: Overbought
- 20 and below: Oversold
Also, the K line is more sensitive than the D line, and the J line represents the magnitude of the difference between these two lines. We can see this more clearly when calculating the KDJ indicator.
Calculation of KDJ Indicator
To calculate the K, D and J values, as we said before, it is calculated based on the highest price, the lowest price and the closing price in a certain period. To calculate the proportional relationship between these three values, the immature random value (RSV) of the last computation cycle is calculated. Then we calculate K value, D value and finally J value according to soft moving average method.
RSV Calculation
RSV for N days = (Cn - Ln) / (Hn - Ln) × 100
CN: represents the closing price of n days
LN: represents the lowest price in n days
HN: represents the highest price in n days.
K value and D value Calculation
K value of the day = 2/3 × K value of the previous day + 1/3 × RSV of the day
D-value of the day = 2/3 × D-value of the previous day + 1/3 × K-value
If the previous day has no K value and D value, 50 can be used instead.
J value Calculation
J value = (3 * K value of the day) - (2 * D value of the day)
Question 2
Is the random index reliable? Explain
The KDJ indicator, like all other indicators, is not 100% reliable. As with any indicator, there will be times when this indicator gives false signals. These false signals can be understood by using additional indicators (like the ADX indicator) as we have thoroughly learned to use this indicator and do other indicators. In this way, we can minimize our margin of error and trade more accurately.
The first thing we need to do is to analyze the indicator well by examining it well. In this way, we interpret the signals in the indicator more accurately and it will be healthier for our trading. As a result, no matter how good the indicators are, we cannot trade correctly if we do not know how to use and interpret the indicator. As we said before, not every signal we receive is correct. Therefore, no matter how much we examine the indicator, we must confirm our interpretation with an additional indicator.
The KDJ indicator gives us overbought and oversold signals. And it allows us to determine the points we will enter according to these signals. For this reason, as with many indicators, it is not recommended to be used when the market is moving sideways. Because the indicator does not give correct signals when the market moves sideways.
When we use the KDJ indicator and another additional indicator, we need to use the additional indicator we used as the confirmation indicator. Because the KDJ indicator gives signals faster than many indicators and other indicators may be late in giving signals.
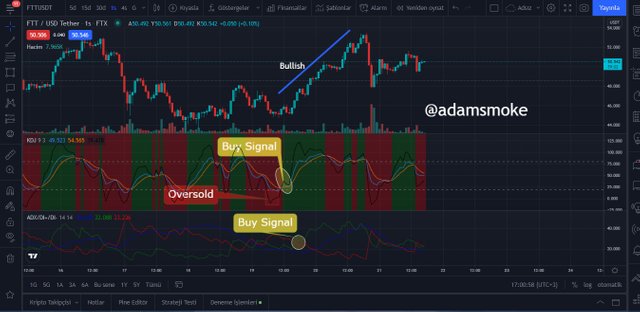
- In the screenshot above, the 1-hour chart of the FTT/USDT pair is used.
As we can see on the screen remind, the J line crosses upwards when the KDJ value is below 20. This signals that it is oversold, and then at the intersection, where the J line crosses upward, a trend change occurs and signals us to buy.
The ADX indicator, on the other hand, gives a buy signal with a slight delay at this point. When we look later, we see that the ADX line exceeds 20 and we expect a nice rise.
The KDJ indicator gave an earlier signal than the ADX indicator because the KDJ indicator works faster than most indicators and gives fast signals. Therefore, it is more likely to give false signals. In this example, we used the ADX indicator as an additional indicator and after confirming our buy signal on the ADX indicator, we were able to open our position more securely.
Question 3
How is the random index added to a chart and what are the recommended parameters? (Screenshot required)
I will demonstrate this task on Tradingview platform.
- First, we go to https://tr.tradingview.com/.
- Next, we open the chart of any asset pair by clicking on the Chart section.
- Next, we click on the Fx button and type KDJ and click on the option I showed in the screenshot.
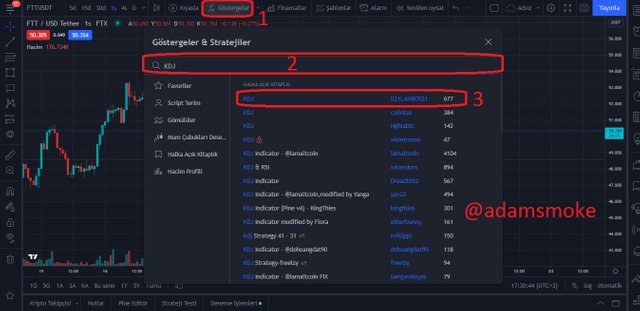
- Then our indicator is successfully added to our chart.
Then we enter the settings section from the section I showed.
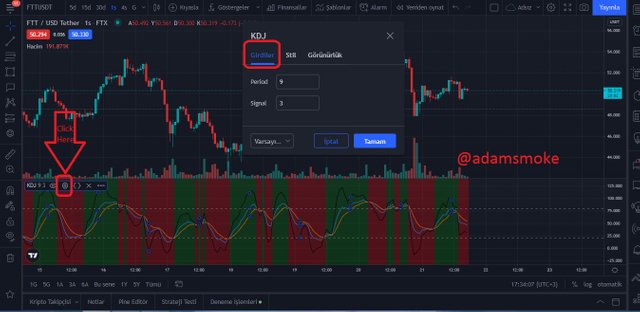
- After entering the Settings section, there is the "Inputs" section on the screen that appears. In this chapter; Period and Signal settings are included. The best period setting is set to 9, the best signal setting is 3.
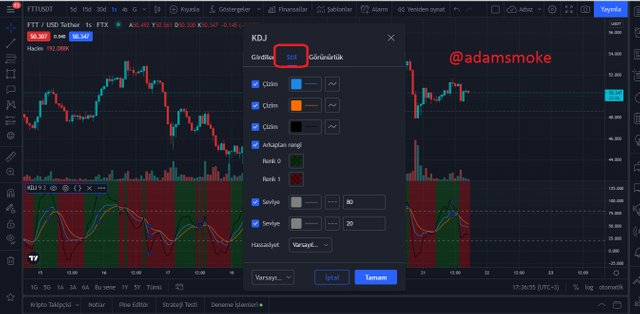
- Then when we click on the "Style" section; There are color settings for K, D and J lines, line thickness settings, background color settings and finally band level settings.
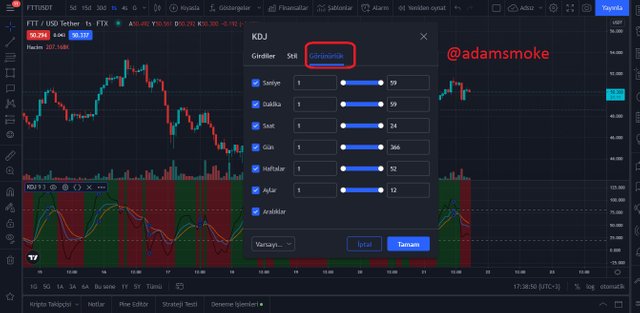
- In the last section, there are Visibility settings. In this section, there are time settings.
If we say that the KDJ settings are the best settings like this, we wouldn't be exactly right. Because these settings can be changed according to the trading method we will do, but as a result of the settings we change, we may experience problems such as too many false signals or delay in signaling. Therefore, the standard settings used are as follows.
Question 4
Differences between KDJ, ADX, and ATR
While the main purpose of many indicators is to help traders with their trades, they have different things to tell us.
When used alone, the ADX indicator is simply an indicator that shows traders whether the trend is present and the strength of the trend. There is a fluctuation range between 0-100 values and above 25 it indicates that there is a trend. What the values of the ADX indicator mean to us is in the table below.
| ADX Value | Ttrend |
|---|---|
| 0-25 | No trend or very weak |
| 25-50 | Strong Trend |
| 50-75 | Very Strong Trend |
| 75-100 | Extremely Strong Trend |
The ADX indicator is a very nice trend-setting indicator, but it does not show the direction of the trend, only its strength. The KDJ indicator also gives us information about the direction of the trend compared to the ADX indicator.
When the J line on the KDJ indicator moves above other lines on the indicator, it indicates an uptrend. Likewise, when the J line moves below the other lines, it indicates a downtrend. In addition to the trend direction, the KDJ indicator also gives us the signals of the points where we will buy and sell. It is therefore a more comprehensive indicator than the ADX indicator.
The ATR indicator, on the other hand, does not show us that there is a trend or the direction of the trend. The ATR indicator tells us about the volatility in the price of any asset. This volatility tells us the gap between prices. There is volatility on the price of any asset in a trend change, uptrend and downtrend, which shows us that the volatility is increasing. This is where the ATR indicator comes into play; The higher the ATR value, the greater the volatility, the lower the volatility. In other words, as we said before, the ATR indicator does not help us to determine a trend direction or our future movements like the KDJ indicator. It only gives us information about price volatility.
Question 5
Use the signals of the random index to buy and sell any two cryptocurrencies. (Screenshot required)
1. Installation
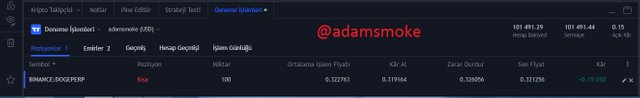
I will show my first setup on the DOGE/USD pair 5 minute chart.
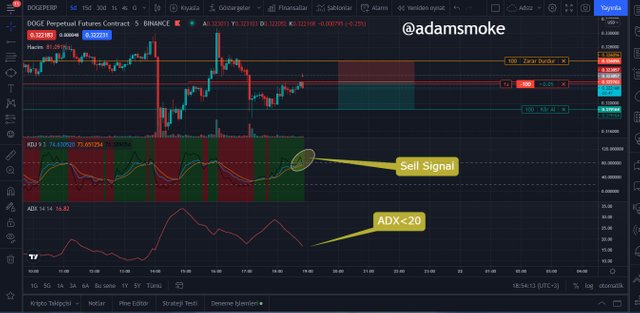
- As you can see in the screenshot above, I used the KDJ and ADX indicators during my trading.
When I first look at the KDJ indicator, I see that it is hovering at 80 and I see that the J line has started to cut the other lines from the top down. This gives me a sell signal. However, when I look at the trend, I see that the price is rising. This is why when I look at my ADX indicator, I see that the ADX value is lower than the 20 level. This shows us that there is no trend or a very low trend. Therefore, I think the trend will change and the price will decrease and I take my sell position at $0.32763. Then I draw a support line to the point where the price first reacted and set this point as my take profit level. If the transaction does not go as I want, I determine the first high reaction point that the price will encounter as Stop-loss.
Transaction Summary
Entry Point: $0.322763
Stop-loss: $0.326056
Take Profit: $0.319164
Risk:Reward 1:1.3
2. Installation
I will show our second setup DOGE/USDT pair on the 5-minute chart.
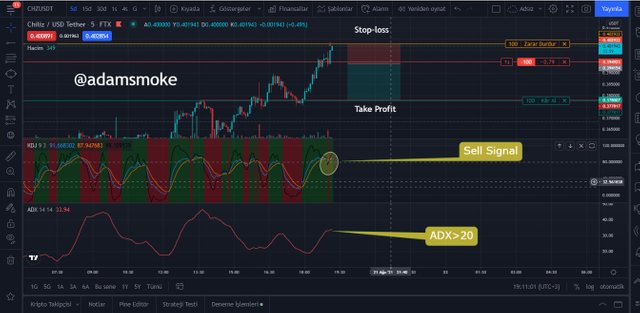
- As you can see in the screenshot above, I used the KDJ and ADX indicators during my trading.
When I first look at the KDJ indicator, I see that it is hovering at 80 and I see that the J line has started to cut the other lines from the top down. This gives me a sell signal. However, when I look at the trend, I see that the price is rising. This is why when I look at my ADX indicator, when I look at the ADX indicator, I see that the ADX value is moving above the 30 level and this tells me that there is a strong trend. This trade I actually took a wrong position. When I look at the general trend of the market, I see that it is in an uptrend and with the ADX indicator, I should have seen that this uptrend was a strong trend, but I did not see it. I then took my position to sell at $0.394923. Later, when I looked at the J line on the KDJ indicator, I saw that it went above the other lines again, but I shared this transaction with you so that you can see my wrong trade. After opening my position, I set myself a risk:reward level of 1:1.84 to take profit and stop-loss level.
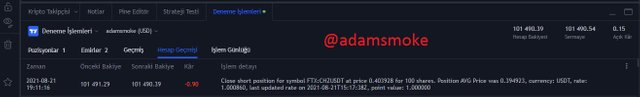
- Since I couldn't interpret the indicators properly while I wanted to make a quick trade, our trade was Stop-loss with a loss of 0.90 dollars.
Conclusion
The KDJ indicator is not a very popular indicator because it is a younger indicator. That's why I used this indicator for the first time and I saw that it is actually a practical and easy to use indicator. In addition to showing the direction of the trend, the KDJ indicator also gives us information about overbought and oversold levels. The indicator is a fast indicator so there is a chance of giving false signals or traders may misinterpret the signals (like me). For this reason, in order to understand what the indicators want to tell us in this lesson, we should use additional indicators and master these indicators. For this reason, I have shown you one correct installation and one incorrect installation.
Thanks again to everyone who read my post.
See you on Steemit Crypto Academy Season 4.
Hi @adamsmoke, thanks for performing the above task in the eighth week of Steemit Crypto Academy Season 3. The time and effort put into this work is appreciated. Hence, you have scored 6 out of 10. Here are the details:
Remarks
Though you have not provided new information to the academy, you have displayed a fair understanding of the topic. You have performed the assigned task excellently. However, you did not provide new information to the course. Also, you work could benefit from another round of proofreading.
That said, this is good work. Thanks again for your contributing your time and effort to the academy.