Crypto Academy Season 03 - Week 08 | Homework Post for @cryptokraze - Trading Sharkfin Pattern

Introduction
Helo all,
Welcome to the last week of Steemit Crypto Academy season 3. This season, we learned many innovations and strategies about the crypto world thanks to the lectures of the professors. There will be another trade model on the subject that I will cover in my post this week.
There are many models of the reverse trading method. Through the professors we learn these methods and in beautiful and fun ways with models. Our trading method model for this week; It will be Trading Sharkfin Pattern. Professor @cryptokraze explained this model in detail and beautifully in his lecture this week. Those who do not know about the subject can find information about this model with the link I will leave. (https://steemit.com/hive-108451/@cryptokraze/crypto-academy-season-03-week-08-or-advanced-course-trading-sharkfin-pattern)
Thank you to everyone who reads my post. I wish you all a healthy and beautiful day.

Question 1
What is your understanding of Sharkfin Patterns. Give Examples (Clear Charts Needed)
We all know that there are uptrends and downtrends on the market. While the market is in a fast uptrend or downtrend, when the trend quickly reverses, it moves by forming a V letter structure on the price chart. This movement is called V Shape Pattern when it occurs in a downtrend and Inverted V Shape Patter when it occurs in an uptrend. These reversal patterns are called Sharkfin Patterns.
Sharkfin Patterns generally result in a trend reversal on the market. The reversals of these trends are sometimes long and sometimes short-term. At this point, the issue we need to pay attention to is that we need to know when to exit our position during our trade. We will continue on these issues in more detail later. Now let's see how Sharkfin Patterns work on the chart.
V Shape Pattern
The V Shape Pattern appears as a reversal when the market is generally in a downtrend. At the same time, when the market is in an uptrend, it can also appear as a short reversal trend.

- The above screenshot shows the 1-hour chart of the BTC/USDT pair.
- As we can see in the screenshot, the price goes down quickly while in a downtrend, as a result, it sees a quick reversal reaction and the price rises quickly and then continues to rise for a certain period of time. As the price makes these movements, it leaves a V shape on the chart.
Inverted V Shape Pattern
Inverted V Shape Pattern appears as a reversal when the market is generally in an uptrend. At the same time, when the market is in an uptrend, it can also appear as a short reversal trend.

- The above screenshot shows the 1-hour chart of the XRP/USDT pair.
- As we can see in the screenshot, while the price is in a bullish move, it makes a reversal and leaves an Inverted V shape on the price chart.
Note: The issue that we need to pay attention to when trading with this trading model is not to get stuck in the trade by determining our exit point from the trade. Because not all of these reversal movements of the price may cause a trend change.
Question 2
Implement RSI indicator to spot sharkfin patterns. (Clear Charts Needed)
When trading with Sharkfin Patterns, we need to use additional indicators so that we can make accurate determinations. One of these indicators is the RSI indicator. Before moving on to trading Sharkfin Patterns with the RSI indicator, let's briefly recall what the RSI indicator is.
RSI Indicator
The RSI indicator, which stands for Relative Strength Index, allows us to determine the overbought and oversold points according to the period we will determine on the chart. The RSI indicator has values between 0-100. When the RSI value drops below 30, it tells us that it is oversold and we know that the price has entered the oversold region. When the price goes above 70, it signals that there is an overbought and we understand that the price has entered the overbought* region.
The standard period setting of the RSI indicator is 14 periods. This period setting can be changed according to our trading method and trader. However, the point we must remember is that when we reduce or increase the period setting to a level lower than 14, we may receive false signals or late signals.

- In the screenshot above, we see the Oversol and Overbought levels on the RSI indicator attached to a chart.
For those who do not know how to add an indicator, I will briefly show the process of adding the RSI indicator to the chart on the Tradingview platform.
- First we open the chart of any of our cryptocurrency pairs.
- Then we click on the Fx (Indicators) button on our Chart.
- Next, we type Relative Strength Index (RSI) in the search section and select the option I showed from the results.
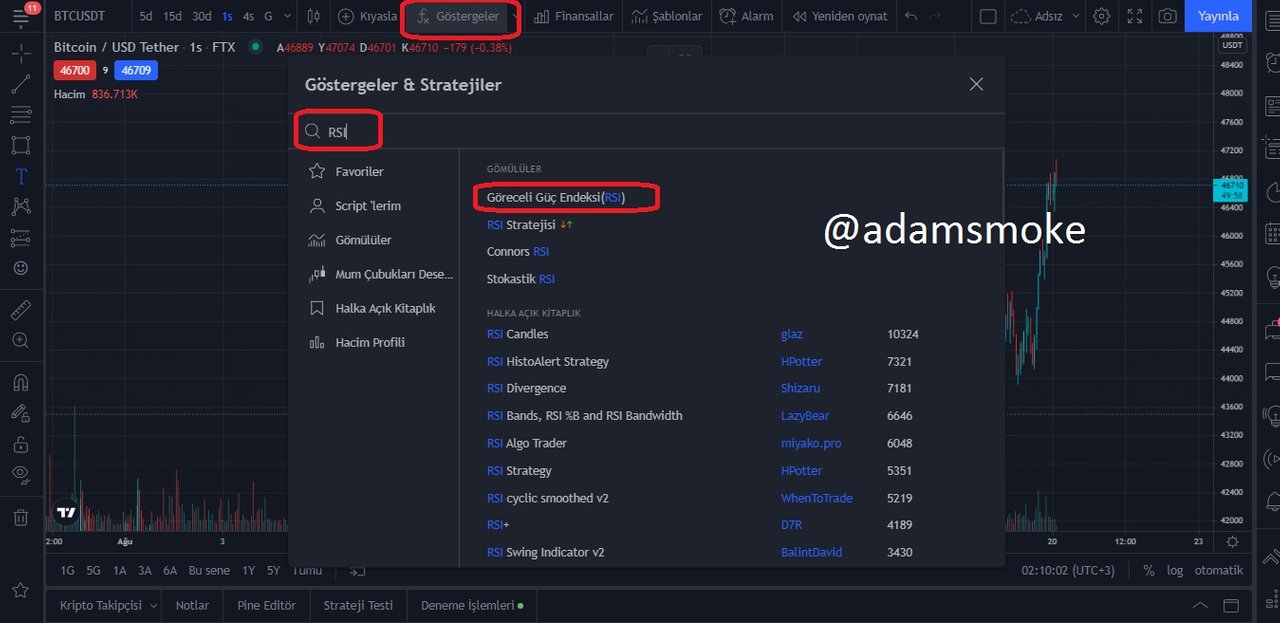
- In our chart above, the steps to add the RSI indicator on the 1-hour chart of the BTC/USDT pair are shown and the RSI indicator has been successfully added to our chart.

Placing RSI on Spot Sharkfins
The first thing we need to do is add the RSI indicator to our chart. In order for us to be able to make accurate determinations later, we make the standard settings of our RSI indicator, with the Bands at 30 and 70 levels and the length of 14.
Declining Trend Reversal Pattern
As we mentioned earlier, the RSI should drop below the 30 level in a bearish reversal pattern. It should then take a quick turn to rise above the 30 level. In this model, a V shape appears both on the chart and on the RSI indicator and we validate our Sharkfin model.

- In the screenshot above, the 1-hour chart of the BTC/USDT pair is used.
- As we can all see in the screenshot, while the price is in a downtrend, it falls below the 30 level on our RSI indicator, entering the Oversold zone and quickly exiting this zone and rising back up. During this movement of the price, a V shape appears on the chart. Thus, we validate our Sharkfin model.
Uptrend Reversal Pattern
As we mentioned earlier, the RSI should rise above the 70 level in a bullish reversal pattern. It should then take a quick turn and drop below 70. In this model, an Inverted V shape appears on both the chart and the RSI indicator and we validate our Sharfin model.

- DOGE/USDT pair 1 hour chart is used in the screenshot above.
- As we can see in the screenshot, the price is making a rapid rise and then quickly falling, performing a quick reversal. Meanwhile, the RSI indicator rises above the 70 level and is falling back. As a result of this movement of the price, an Inverted V shape is formed on our chart and the price is in the Overbought region on the RSI indicator. Thus, we validate our Sharkfin model.
Question 3
Write the trade entry and exit criteria to trade sharkfin pattern (Clear Charts Needed)
Purchasing Criteria
Entry Criteria for Purchasing Position
- First of all, we add the RSI indicator to our chart with its standard settings.
- Next, we expect the price to make a rapid downtrend and then take a quick turn to rise. So we expect the price to move in a V.
– While we wait for the price to move fast, we expect the RSI indicator to drop below the 30 level and then quickly rise back to the 30 level. So we expect the RSI indicator to make a V shape. - To place the Buy order later, we make sure our RSI level is clearly above 30 and we take our position.

The screenshot above shows the 1-hour chart of CHZ/USDT.
Exit Criteria for a Buying Position
- Before determining our exit point, the first thing we need to do is to set a Stop-loss level against our trade going in the direction we do not want. We place this stop-loss point below the level where our Sharkfin pattern oscillates.
- If the price moves in the direction we do not want and falls below the oscillation point of our Sharkfin model, our position will be closed and our setup will be broken. At this point, we expect a new installation.
- Then, if our trade goes in the direction we want, we need to set ourselves a take profit level or exit point. this level should be positioned so that our Risk:Reward ratio is at least 1:1. In short, it should be at least equal to our stop loss level.
- Then when the price reaches the point we want, we exit our position or book a profit.

- The same graphic is used in the screenshot above. ( CHZ/USDT pair 1-hour chart)
- We open our position at $0.206657 at the entry level we set before.
- Then we set our Risk:Reward ratio as 1:1.1, not less than 1:1.
- First, we set our stop-loss level at $0.163180 (21.04%), below our Sharkfin pattern. Then, we set our take profit level to be $0.258337 (23.18%).
Sales Criteria
Entry Criteria for a Sales Position
- First of all, we add the RSI indicator to our chart with its standard settings.
- Next, we expect the price to make a rapid upward move and then make a quick turn and fall. So we expect the price to move in an Inverted V.
– We expect the price to move fast as the RSI indicator rises above the 70 level and then quickly declines back to the 70 level. So we expect the RSI indicator to make an Inverted V shape. - To place the Buy order later, we make sure our RSI level is clearly below 70 and we take our position.

The 1 hour chart of SOL/USDT pair is used in the screenshot above.
Exit Criteria for a Sales Position
- Before determining our exit point, the first thing we need to do is to set a Stop-loss level against our trade going in the direction we do not want. We place this stop-loss point above the level where our Sharkfin pattern oscillates.
- If the price moves in the direction we do not want and goes above the point where our Sharkfin model oscillates, our position will be closed and our setup will be broken. At this point, we expect a new installation.
- Then, if our trade goes in the direction we want, we need to set ourselves a take profit level or exit point. this level should be positioned so that our Risk:Reward ratio is at least 1:1. In short, it should be at least equal to our stop loss level.
- Then when the price reaches the point we want, we exit our position or book a profit.

- The same graphic is used in the screenshot above. (SOL/USDT pair 1-Hour Chart)
- We open our position at the entry level of $35.6875, which we have determined before.
- Next, we determine our Stop-loss and Take Profit levels so that our Risk:Reward level is not less than 1:1.
- We set our stop-loss point at $37,9525 (6.35%), above our Sharkfin pattern. Then, we determine our take profit level to be 33,4225 dollars (6.35%), not less than 1:1.
Question 4
Place at least 2 trades based on sharkfin pattern strategy (Need to actually place trades in demo account along with Clear Charts)
1. Installation
DOGE/USDT Pair 30 Minute Chart Sell Position
First I added the RSI indicator to my chart. Then I saw that the trend was an uptrend and started looking for a sell position. While examining the charts, I saw that a Sharkfin Pattern was formed on the DOGE/USDT pair and I prepared to take my position.
- When I examine the chart, we see that the RSI indicator has risen above the 70 level and quickly reversed below the 70 level.
- When we look at the price chart, we see that a Sharkfin model (Inverted V) has formed.
- It was a good time to take our position and I am determining my sell position at the level of $0.320670.
- Then I adjust my Risk:reward level to not exceed 1:1 ratio. I set my stop-loss level at $0.3327320 (3.74%). I set my take profit level to be $0.3027520 (5.61%). My risk:reward ratio is 1:1.5.

- After I open my position, I wait for a while and see the price move sideways. Since I cannot predict which direction the price will move as a result of such movements, I close my position without loss. I close my position at +0.31 levels.

2. Installation
LTC/USDT 30 Minute Chart Sell Position

- When I examine the chart, we see that the RSI indicator has risen above the 70 level and quickly reversed below the 70 level.
- When we look at the price chart, we see that a Sharkfin model (Inverted V) has formed.
- It was a good time to take our position and I am setting my sell position at $176,405.
- Then I adjust my Risk:reward level to not exceed 1:1 ratio. I set my stop-loss level at $179,400 (1.75%). I set my take profit level to be $173,320 (1.75%). My risk:reward ratio is 1:1.

- After waiting for a long time, I realized that the price movement would not reach the levels I wanted. Therefore, I closed my position at +$4.68 level.
Even though we waited a long time in our initial trade setup, we were unable to make a profit. In situations where the market moves like this, we should not be stuck in the position for too long. We should be able to close my position and look for new installations when necessary. Because we should not forget that the opportunities in crypto assets are endless.
Although we could not achieve the profit rate we wanted in our second setup, we closed our position at a level that can be considered close to our take profit level. The reason why I closed this position was that the price was on the rise with a high rate in BTC parity.

Concluison
I have seen the market rise and fall rapidly in recent days. Sharkfin Patterns is a method that we can use when such ups and downs are fast. In this lesson, I tried to cover all the points of this trading method and conveyed my real setups from my demo account. Since I have not used this trading method before, I chose to use a demo account. You can first reinforce this trading method by experimenting with your demo accounts. I hope my sharing was helpful to you.
Thanks again to everyone who read my homework. I would also like to thank professor @cryptokraze for this beautiful and educational lesson. I wish you all a nice and healthy day.
See you at Steemit Crypto Academy Season 4.
Congratulations! Your post has been selected as a daily Steemit truffle! It is listed on rank 19 of all contributions awarded today. You can find the TOP DAILY TRUFFLE PICKS HERE.
I upvoted your contribution because to my mind your post is at least 9 SBD worth and should receive 25 votes. It's now up to the lovely Steemit community to make this come true.
I am
TrufflePig, an Artificial Intelligence Bot that helps minnows and content curators using Machine Learning. If you are curious how I select content, you can find an explanation here!Have a nice day and sincerely yours,

TrufflePig