Crypto Academy Season 03 - Week 04 | Advanced Course | Homework post for @cryptokraze
Introduction
Hello to everyone.
The subject of this lesson will be dynamic support and dynamic resistance. We all know what support and resistance are. I will try to explain the dynamic support and dynamic resistance issues in a nice way in this lesson.
Later in this lesson, I will explain my dynamic support and dynamic resistance and my trading entry and exit criteria. Then we will get a better understanding of the subject by practicing with demo trades.
Thank you professor @cryptokraze for this nice and instructive assignment. Also, thank you in advance to everyone who reads my homework. I wish everyone a good and healthy time.

Qestion 1
What do you understand about the Concept of Dynamic Support and Resistance? Give Chart Examples from Crypto Assets. (Clear Charts Needed)
In essence, the concepts of support and resistance can be defined as the points where the price reacts in any way or the points where the price recovers.
Support and resistance levels created using exponential moving averages (EMAs) are called dynamic support and dynamic resistance. The reason why we use the word dynamic is that dynamic support and dynamic resistance levels are constantly changing depending on the last price movement, unlike normal support and resistance levels. We will understand this better with the examples I will show in the graph.
Dynamic Support Chart Model
With the help of the exponential moving average (EMA), we first open the chart of our 1-hour BTC|USDT pair to see our dynamic support point. Then we add our EMA indicator to our chart and make its length 50.
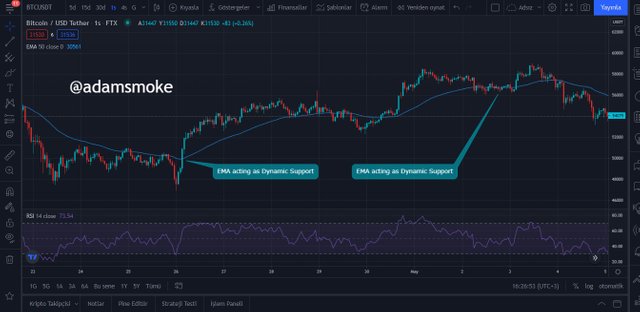
- As can be seen in the screenshot, the EMA50 line acts as a support at the points where the price touches the EMA50 line. The price fluctuates at this point or rises by hitting that point.
Dynamic Resistance Chart Model
Exponential moving average (with the help of the EMA, we first open the chart of our 1-hour BTC | USDT pair to see our dynamic support point. Then we add our EMA indicator to our chart and make its length 50.
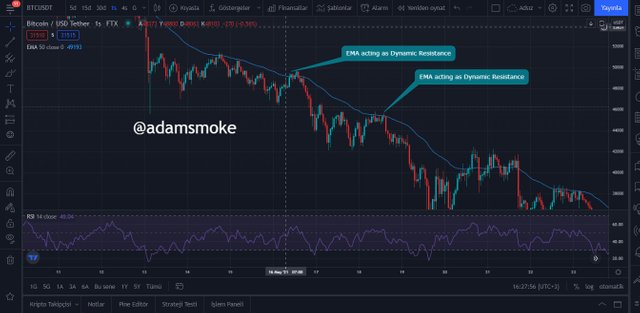
- As can be seen in the screenshot, at the points where the price touches the EMA50 line, the EMA50 line acts as a Resistance. The price hits the EMA50 line at these points and continues to fall back.
Question 2
Make a combination of Two different EMAs other than 50 and 100 and show them on Crypto charts as Support and Resistance. (Clear Charts Needed)
Combination of EMA10 and EMA20
In this section, I will show you our dynamic support and dynamic resistance points by showing the harmony of EMA10 and EMA20.
- First, we open our 1-hour BTC|USDT chart.
- Next, we add the EMA10 and EMA20 indicators to our chart.
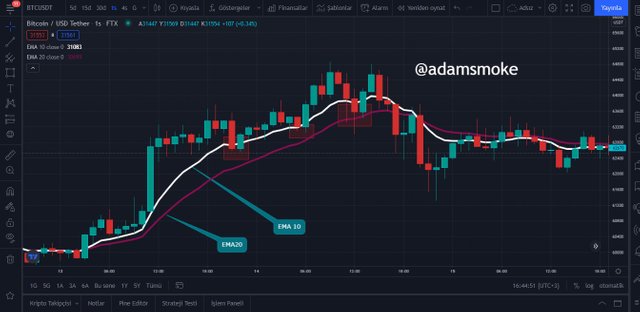
As can be seen in the screenshot, whenever the price touches the area between the EMA10 line and the EMA20 line, the price has risen again. These points are the Dynamic support points that we determined with the combination of EMA10-20.
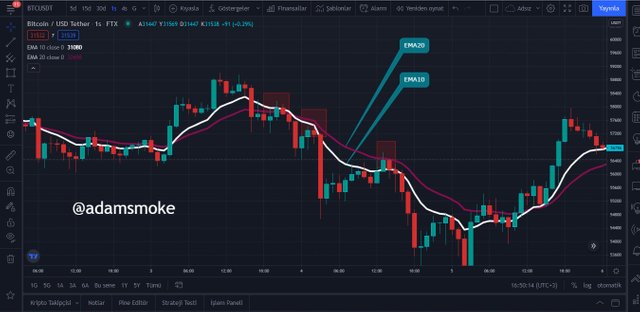
- As you can see in this screenshot, the price has dropped every time it touches the EMA10 line or after entering the area between EMA10-20. These points show us our Dynamic Resistance points.
Question 3
Explain Trade Entry and Exit Criteria for both Buy and Sell Positions using dynamic support and resistance on any Crypto Asset using any time frame of your choice (Clear Charts Needed)
I will not use the EMA10-EMA20 combination we showed earlier in this task. In this task I will demonstrate the entry and exit criteria using the EMA50-EMA100 combination the professor demonstrated.
Trade Entry Criteria
Entry Criteria for a Buy Position
- First of all, we open the graph of the cryptocurrency pair we will trade.
- Next, we add the EMA50 and EMA100 indicators to our chart.
- We make sure the price is above our EMA50 and EMA100 lines for the buy setup to happen.
- Next, we wait for the price to reach the EMA50 line. But we will wait for the price to cross the EMA50 line, not touch the EMA50 line.
- At this point, we should not forget that the direction of the trend will change after the price crosses both EMA lines. Our buy setup will be invalid once the price crosses the EMA lines.
- Then we expect the price to rise again after crossing the EMA50. We make our entrance from the point where we have correctly determined the direction of the price.
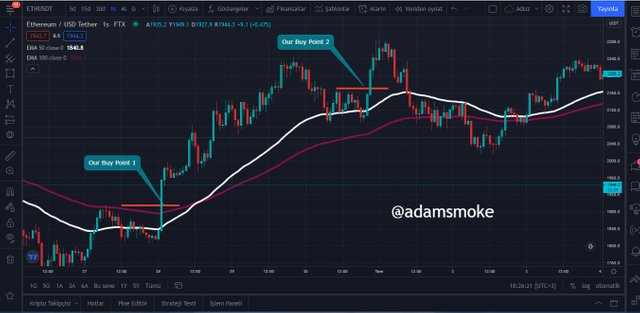
Note: In my opinion, there is a golden rule that we should not forget when trading Cryptocurrency; The opportunities in crypto are endless. If we trade with this word in mind, we will be more careful and cautious. As you can see in the screenshot, we have multiple entry points. If we are patient, we can make more profit in our trades.
Entry Criteria for Sell Position
- Again, we open the cryptocurrency pair chart that we will trade.
- Next, we add the EMA50 and EMA100 indicators to our chart.
- To perform the sell setup later, we make sure the price is below our two EMA lines.
- Next, we wait for the price to approach the EMA50 line. However, we will wait for the price to cross the EMA50 line, not touch the EMA50 line.
- At this point, we should not forget that the direction of the trend will change after the price crosses both EMA lines. Our buy setup will be invalid once the price crosses the EMA lines.
- Then we expect the price to rise again after crossing the EMA50. We make our entrance from the point where we have correctly determined the direction of the price.
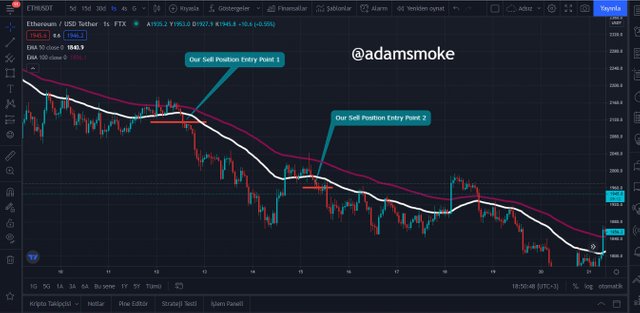
- As you can see in the screenshot, multiple entry points will always be waiting for us. However, those who get on the train early will enjoy the journey more.
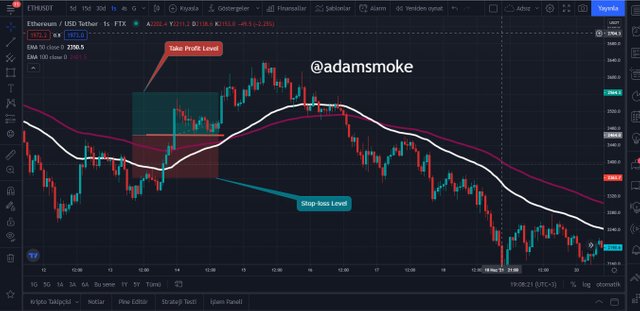
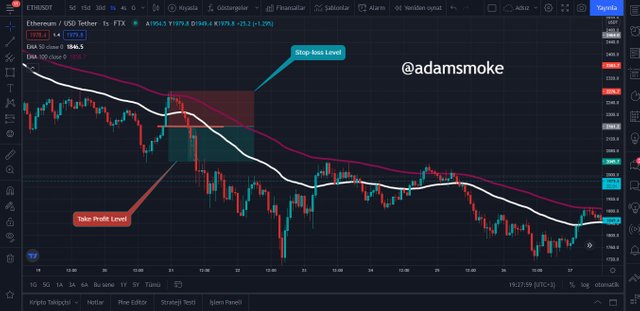
Exit Criteria
In this section, while specifying the exit criteria for both the buy position and the sell position, we will also see how to adjust our take profit and stop-loss points for both the positions we make profits and the positions we lose.
Exit Criteria for a Buying Position
- As we said before, we need to set a stop-loss level for ourselves, considering the possibility of loss after opening our position.
- We set our stop-loss level at a point below the EMA100 line. When the price drops below our stop-loss level, our position will be closed and we will have blocked the loss. Then we can wait for a new installation.
- If the price is moving in the direction we want after opening our position, we need to set a Take Profit level for ourselves.
- We must keep this take profit level at least 1:1 (risk:reward) with our stop-loss level.
- After the price reaches our take profit level, we should close our position or take our profit.
Exit Criteria for a Sell Position:
- As we said before, we need to set a stop-loss level for ourselves, considering the possibility of loss after opening our position.
- We set our stop-loss level at a point above the EMA100 line. When the price reaches a point higher than our stop-loss level, our position will be closed and we will have blocked the loss. Then we can wait for a new installation.
- If the price is moving in the direction we want after opening our position, we need to set a Take Profit level for ourselves.
- We must keep this take profit level at least 1:1 (risk:reward) with our stop-loss level.
- After the price reaches our take profit level, we should close our position or take our profit.
Questions 4
Place 2 demo trades on crypto assets using Dynamic Support and Resistance strategy. You can use lower timeframe for these demo trades (Clear Charts and Actual Trades Needed)
BHC/USDT Pair
BHC/USDT pair, Entry for Buy position
- In this task, I will execute my trades using my Tradingview (https://tr.tradingview.com/) demo account.
- First, we choose the cryptocurrency pair to trade. I chose the BHC/USDT pair for this position.
- Then we open our 5-minute BHC/USDT chart.
- Then we add the EMA50 and EMA100 indicators to our chart.
- Then we wait for the price to reach the EMA50 line to determine our dynamic support level.
- Then after our price hits our EMA50 level, we wait a bit and make sure it drops below EMA50.
- Then we wait for the price to rise again and open our position when it crosses the EMA50 level.
- The price level at which I made a purchase; 426,075 USDT. Then, we determine our risk/reward levels at a ratio of at least 1:1 for our position and determine the take profit and stop-loss values.
- Stop-loss value: 420,375 USDT, Take profit value: 432,525 USDT. Our risk/reward ratio is 1:1.1.
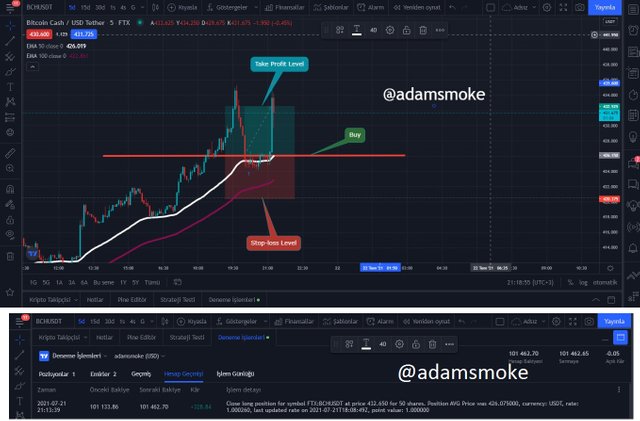
- Our transaction is completed and our position is closed with +328.84 dollars Profit.
BTC/USDT Pair
*BTC/USDT pair, Entry for Buy position
- In this task, I will execute my trades using my Tradingview (https://tr.tradingview.com/) demo account.
- First, we choose the cryptocurrency pair to trade. I chose the BTC/USDT pair for this position.
- Then we open our 5-minute BTC/USDT chart.
- Then we add the EMA50 and EMA100 indicators to our chart.
- Then we wait for the price to reach the EMA50 line to determine our dynamic support level.
- Then after our price hits our EMA50 level, we wait a bit and make sure it drops below EMA50.
- Then we wait for the price to rise again and open our position when it crosses the EMA50 level.
- The price level at which I made a purchase; 32131 USDT. Then, we determine our risk/reward levels at a ratio of at least 1:1 for our position and determine the take profit and stop-loss values.
- Stop-loss value: 31756 USDT, Take profit value: 32538 USDT. Our risk/reward ratio is 1:1.07.
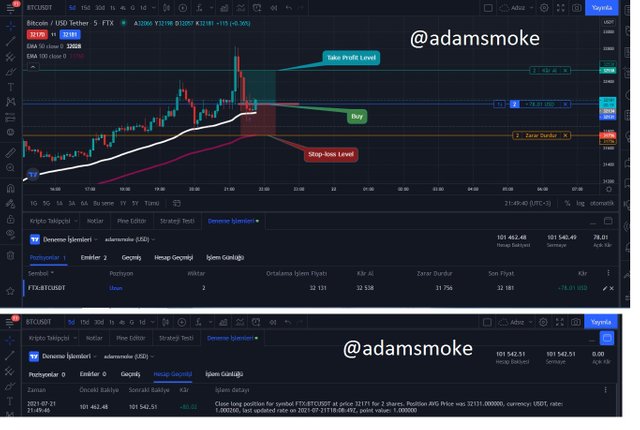
- I closed my trade in a position where I made a profit of +80 dollars before our trade reached the take profit or stop-loss level. Because I had waited too long and the price was going up and down fast. Therefore, I closed my position myself when I reached +80 dollars.
Conclusion
What is dynamic support and resistance in this lesson? I tried to explain your question with examples. After determining the dynamic support and resistance levels that we determined with the EMA indicator, we saw how to trade with this information. This trading method is a bit of a fast trading method in my opinion. Even though I don't like to trade quickly, I really like this trading method. I hope I was able to explain to you well what I know.
I wish everyone good and healthy days again.
Dear @adamsmoke
Thank you for participating in Steemit Crypto Academy Season 03 and making efforts to complete the homework task. You got 8.5/10 Grade Points according to the following Scale;
Key Notes:
We appreciate your efforts in Crypto academy and look forward for your next homework tasks.
Regards
@cryptokraze
Thank you professor.