[Alligator Indicator]- Crypto Academy /S5W3-Homework Post for kouba01
Introduciton
Hello to everyone,
During our trading, many indicators provide us convenience and shed light on our way. These indicators and oscillators are quite numerous. This post will be about one of these indicators, the “Alligator Indicator”. I would like to thank everyone who read my post and professor @kouba01 who explained this lesson.

Quesiton 1
Discuss your understanding of the use of the Alligator indicator and show how it is calculated?
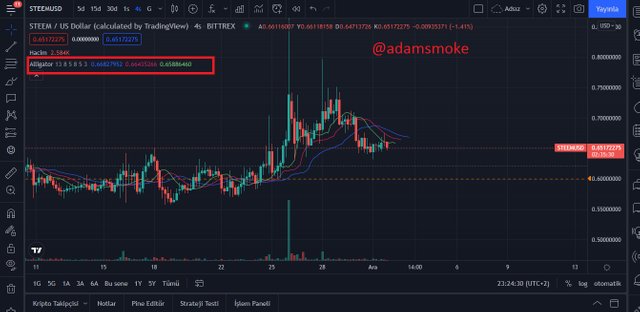
The Alligator Indicator was first introduced in 1995 by Bill Williams, one of the pioneers of market psychology. The Alligator Indicator is a very easy to use indicator. It is an indicator that even a beginner trader can easily use and understand. Our indicator is built with 3 moving averages. The appearance of this indicator on the chart is in the form of 3 lines. Each of these lines represents a moving average and its appearance on the chart is in 3 different colors. These are the colors red, blue and green. As we can understand from its name, this indicator is associated with the “Crocodile”. For this reason, each line in 3 different colors that we see in our indicator is associated with a crocodile.
We said that these lines are also moving averages. These moving averages are:
- Blue (Alligator jaw) = 13 period smoothed moving average and 8 periods shifted forward.
- Red (alligator teeth) = 8 period smoothed moving average, shifted forward 5 periods.
- Green (alligator lips) = 5 period smoothed moving average and 3 periods shifted forward.
If we put the above information into a table so that we can understand it more easily.
| Line Color | Period | Offset |
|---|---|---|
| Green Line ( Lips) | 5 | 3 |
| Red Line (Teeth) | 8 | 5 |
| Blue line (Jaw) | 13 | 8 |
Bill Williams thinks that there is no trend in the market most of the time, and he calls the time when there is no trend, the "sleeping" phase. So much so that she thought that there was no trend on the market at a rate of 70-80% and that there was a trend on the market only at a rate of 15-30%. Again, according to Williams, the times when traders made big bucks were when there was a trend. Therefore, the Alligator indicator is a trend following indicator.
For this reason, the Alligator indicator is used to determine whether the market is in a trend or not and the strength of the current trend. It also gives us information about when the trend on the market will end (reverse). In addition to these, the Alligator indicator also gives us buy and sell signals, as with many indicators.
If we come to the crocodile analogy, we can describe it as the time elapsed until the trending time when there is no trend in the market (sleep mode). This time interval is defined as the crocodile's sleep interval. Then, since the crocodile will not sleep forever, the crocodile wakes up and starts hunting its prey. This is directly proportional to the duration of the hunt and the aggression during the hunt and the time it sleeps. In short, the longer the crocodile sleeps, the more hungry it will be when it wakes up. Therefore, the longer the market stays in the dormant phase, the stronger the upcoming trend will be.
How to Calculate Alligator Indicator?
We've all learned what the moving averages on our indicator mean. Let's examine the mathematical formula behind these moving averages.
- Average Price: = (High + Low)/2
- Crocodile's Jaw: = SMMA (Average Price 13.8)
- Crocodile's Teeth: = SMMA (Average Price 8.5)
- Crocodile's Lips: = SMMA (Average Price 5, 3)
SMMA = Smoothed Moving Average, High = Highest Price, Low = Lowest Price
Quesiton 2
Show how to add the indicator to the chart, How to configure the Alligator indicator and is it advisable to change its default settings ?. (Screenshot required)
In this section, I will use the Tradingview platform when adding our indicator to our chart.
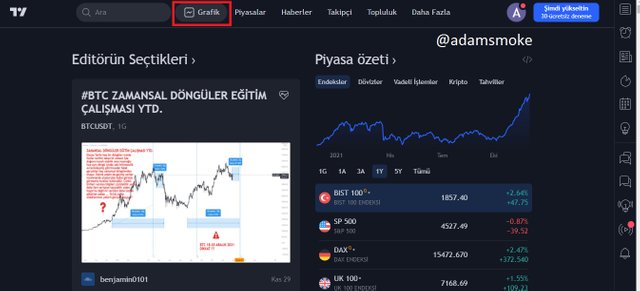
The first thing we need to do is go to the Tradingview platform. Then on this platform, in order:
- We open the graph of any couple. For this, we just need to click on the “Chart” button and then you can choose the pair you want.
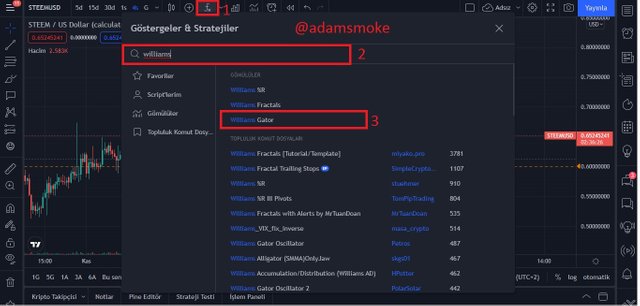
- Then we click on the Fx (Indicators) button at the top of our chart.
- Then, when we type Williams in the search section, we choose the "Williams Gator" option from the results.
- Then our indicator is successfully added to our chart.
How to Configure Alligator Indicator?
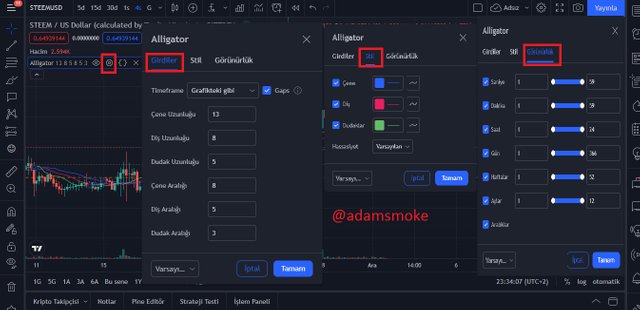
After successfully adding our indicator to our chart, we click on the settings section from the section where the indicator is located. After clicking on the Settings section, we are greeted by the screen where we can configure our indicator as we want. If we specify the configuration settings in this section, respectively:
- “Inputs” = This section contains the length and spacing settings of the moving averages (Crocodile's jaw, lips, teeth) on our indicator.
- “Style” = In this section, there are settings where we can customize the colors and line shapes of the moving averages (Crocodile's jaw, lips, teeth) on the indicator.
- “Visibility” = In this section, there are time settings.
. is it advisable to change its default settings
Changing the settings of the indicators according to our trading style and behavior allows us to get accurate results for many indicators. However, this is not quite so for our Alligator indicator. Because Bil Williams used Fibonacci levels while structuring this indicator. 5.8 in our indicator. All 13 levels and 3.5.8 levels with offsets represent Fibonacci numbers. Fibonacci levels have proven themselves many times during our trading, as his professor said: when examining trends, identifying support and resistance levels, choosing our entry and exit points, etc.
Quesiton 3
How do we interpret this indicator from its 3 phases: the period of rest(or sleep), awakening, and the meal phase?(Screenshot required)
Our indicator is likened to the different movements of the crocodile, as we mentioned earlier. For this reason, the three phases in our indicator are likened to a crocodile;
- Resting (Sleep) Phase,
- Awakening Phase,
- Food Phase
It is in the form. Now let's interpret what these phases mean and try to show them with examples.
Resting (Sleep) Phase
As we can understand from its name, this phase is likened to the resting (sleeping) phase of a crocodile. The crocodile sleeps in this phase and there is no movement. In the market, this phase is the part where there is no trend. In this phase, the market moves sideways.
Again at this stage, no movement can be seen in the lips, teeth and jaw of the crocodile, and there is no certain movement in the lines of the moving averages representing these sections, they are irregular and overlap.
It is not recommended to do any trading on the market during this phase. Because trading in a non-trend market is no different than gambling and can hurt us.
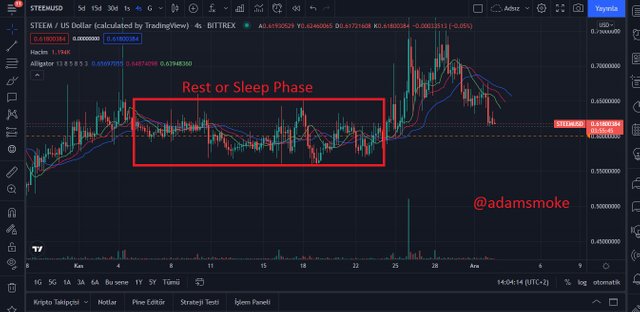
As we can see in the screenshot above, there is no trend on the market during the Resting phase. We should not trade while the market is in this phase. Because we all know that when the market moves sideways, it prepares for a trend and this trend is difficult to predict. Therefore, it is better to wait for the upcoming trend rather than trading in this region.
Awakening Phase
A sleeping crocodile is very hungry when it wakes up. Therefore, the crocodile opens its mouth wide and begins to eat. Then, when the crocodile is full, it goes back to sleep.
On the market, this awakening phase is called the forming phase of the 3 moving averages and is likened to a crocodile opening its mouth. At this point, the 3 moving averages diverge.
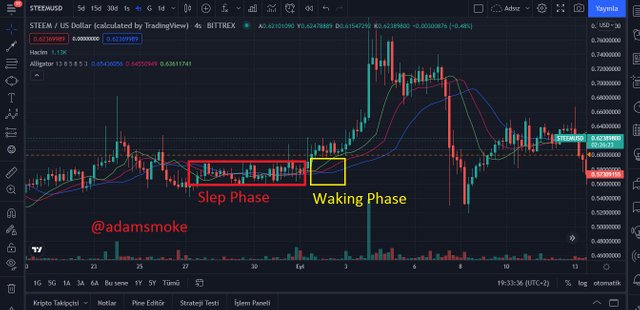
As we can see in the screenshot above, after the sleep phase is over, the waking phase begins. At this stage the moving averages start to diverge and this tells us that a trend has started.
Eating Phase
The eating phase is the phase in which the direction of the trend is determined and strengthened. At this stage, the hungry crocodile begins to feed and the trend is established and strengthened. Depending on the position of the moving averages, the crocodile can feed either in a bearish or an uptrend.
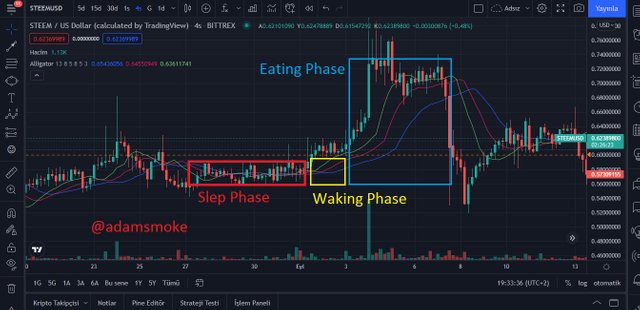
As we can see in the screenshot above, after the sleep phase is completed, the crocodile enters the awakening phase and opens its mouth. Then he starts to eat. This is also the phase when our moving averages diverge and expand. This phase is the phase where traders sell or buy. This is the phase in which we profit in our trade. Again, this is the phase where the market has a trend, and this is the time to take the 15-20% profit that Williams talks about.
Quesiton 4
Based on the layout of its three moving averages that make up the Alligator indicator, how can one predict whether the trend will be bullish or bearish (Screenshot required)
We all know what the sleep phase means in the crocodile indicator. After the sleep phase, a trend will occur in the market. Determining whether this emerging trend is bullish or bearish will be quite easy thanks to our 3 moving averages in our indicator.
During the sleep phase, our lip, teeth and jaw lines on our indicator move close to each other and when a trend starts, these 3 lines move away from each other and widen. In this way, we can easily understand that a trend has started, weakened or exhausted. Now that we have provided this information, let's move on to determining whether the trend is bullish or bearish.
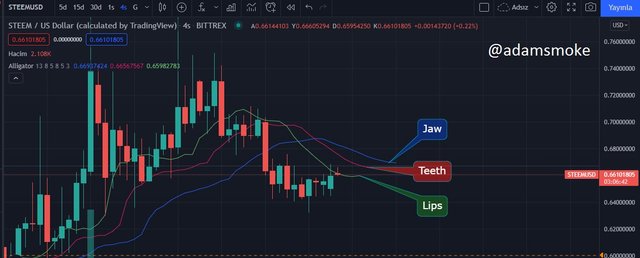
Bullish Trend: In order to define this trend, it is necessary to pay attention to the order of the 3 moving averages. If there is a blue line (Chin) at the bottom and a green line (Lips) at the top, it tells us that the trend is a Bullish Trend.
Bearish Trend: In this trend, the blue line (Chin) is at the top and the green line (Lips) is at the bottom. If we see a ranking like this it tells us that the Trend is Bearish.
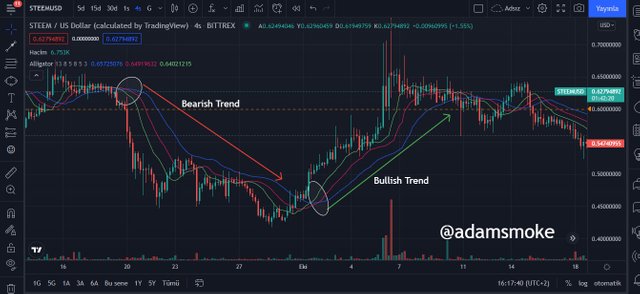
The above screenshot shows the Steem/USD pair. As you can see in the screenshot, when the Bearish Trend starts, the Blue line is at the top and the green line is at the bottom. Likewise, when Bullish Trend starts, the Blue line is at the bottom and the green line is at the top.
Quesiton 5
Explain how the Alligator indicator is also used to understand sell / buy signals, by analyzing its different movements.(screenshot required)
Crocodile indicator is one of the indicators that we can follow the trend. In this indicator, we can clearly see the beginning and end of the trend. In this way, we can perform our buying or selling transactions while the trend is starting or ending. To explain these buy and sell signals more clearly: The buy and sell signals in the Alligator indicator are generally made by interpreting our lines of 3 moving averages.
Buy Signal: The buy signal is usually executed at the beginning of an uptrend. When the blue line is aligned at the bottom and the green line at the top, the uptrend has started. This is a buy signal for us.
Sell Signal: On the other hand, the sell signal is generally executed at the beginning of the downtrend. When the blue line is aligned at the top and the green line at the bottom, it indicates that the downtrend has started. This is a Sell signal for us.
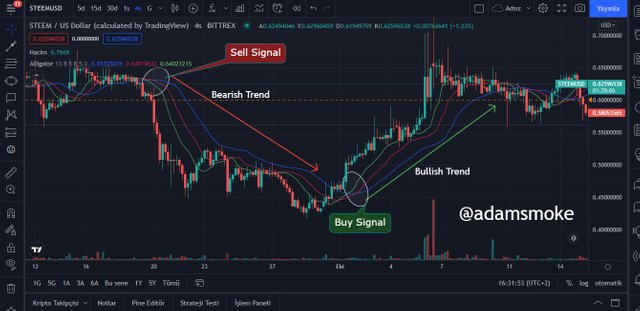
As you can see in the screenshot above, after the sleep phase, our 3 moving averages are lined up with blue at the top and green at the bottom. We know this is the Bearish trend start and at this point we execute our Sell. Likewise, after the Bearish trend is exhausted, the trend reverses and the Bullish trend begins. At this point, the position of the moving averages changes, with the green line at the top and the blue line at the bottom. When this ordering takes place, it gives us a buy signal and at this point we can make our purchase.
Quesiton 6
Do you see the effectiveness of using the Alligator indicator in scalping trading style? Explain this based on a clear example.(Screenshot required)
Scalping trading method is a trading method in which we make small profits by opening many trades during the day. With this method, buying and selling transactions are carried out in minutes or even seconds, and large profits can be obtained with small profit shares. This trading method can also bring good profits during periods when the market moves sideways. In our Alligator indicator, we can say that this trading method is suitable because the time spent in the sleep phase (sideward movement) is around 80%. We can see this more clearly on a graph.
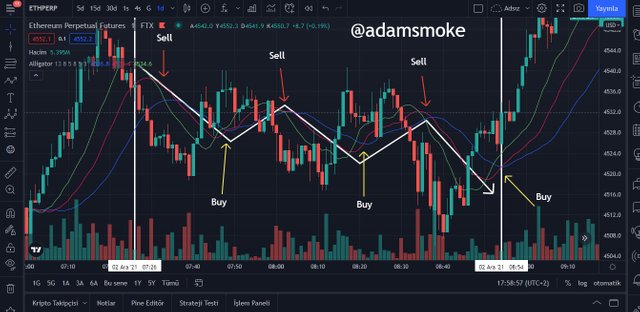
The screenshot above shows the 1-minute chart of the ETH/USD pair. On this chart, the buy and sell signals received with the Alligator indicator between 7:26-8:54 on December 2 are shown. Our indicator, which produces multiple signals even in this short time, can sometimes provide late signals, but it can offer a profitable trading opportunity for traders who want to trade scalping.
Question 7
Is it necessary to add another indicator in order for the indicator to work better as a filter and help get rid of unnecessary and false signals? Use a graph to support your answer.
As with all indicators, this indicator cannot produce 100% accurate signals. For this reason, it is necessary to use additional indicators to filter out false signals or verify the signals we receive. Since our alligator indicator is a trend following indicator, it would be a better decision to use another trend follower indicator to confirm the signals received. For this reason, I find it more appropriate to use the ADX indicator, which is one of the most popular of these indicators.
The ADX indicator is simply a single line indicator that shows the strength of the trend and is a clear indicator that tells us only if the trend is present on the market. The ADX indicator does not show the direction of the trend in any way, but when combined with the DMI lines it allows us to understand not only the strength of the trend but also its direction. For this reason, it would be more accurate to use the ADX indicator with DMI lines.
Based on the ADX indicator, it is an indicator that has a value between 0-100 and below the 25 level tells us that there is no trend. Above 25 is considered a trend start, above 50 it is considered a strong trend. When we supplement our ADX indicator with our DMI lines: +DI helps us to understand that the market is in an uptrend, while our -DI line helps us to understand that the market is in a downtrend.
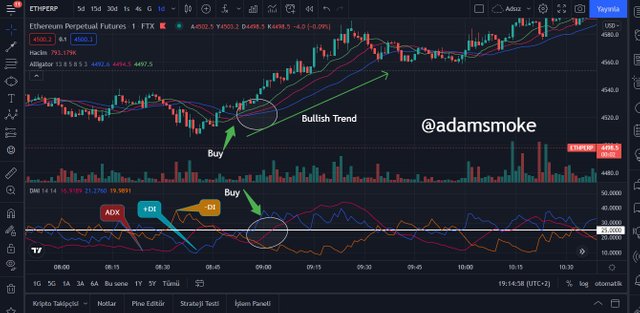
The screenshot above shows the chart of the ETH/USD pair. As we can see in this screenshot, we are getting a buy signal on our alligator indicator. Next, let's say we want to validate this signal in our ADX indicator.
After receiving the buy signal on our Alligator indicator, we look at our ADX indicator. On our ADX indicator, the ADX indicator has moved above 25 which tells us that a trend has started. Then, when we look at our +DI and -DI lines, we see that our +DI line moves in the positive direction. This shows us that the market will enter an uptrend. In other words, we confirm the position we will open by confirming the same signal we received in our Alligator indicator in our ADX indicator.
In short, we were able to verify the signal we received in our Alligator indicator in our ADX indicator, and as a result, we can easily take our buy position.
Question 8
List the advantages and disadvantages of the Alligator indicator:
Advantages
- The Alligator Indicator, as we said at the beginning, is a very easy to use indicator. For this reason, it is an indicator that even traders who are new to trading can easily read and understand.
- Thanks to the 3 moving averages in it, the margin of error is less than many other indicators. In this way, the rate of generating false signals is less than other single moving average indicators.
- The Alligator indicator is an indicator that can be used in all timeframes.
- It does not need to be configured according to the way we trade, its default settings are an expertly crafted indicator and these numbers are Fibonacci numbers.
Disadvantages
- Like almost every moving average, our Alligator indicator is a lagging indicator.
- It may be insufficient in momentarily changing price movements.
- Accuracy is reduced when changing default settings.
Conclusion
We have seen in detail our “Alligator Indicator”, which allows us to identify trends in the market and gives us the necessary buy and sell signals. We have seen that this indicator, like other indicators, can give incorrect results when we configure it according to our trading method and can be used in all trading methods with its default settings. It is a lagging indicator due to the fact that it is generally composed of moving averages and may produce false signals. For this reason, we saw that it would be more accurate to use it with different indicators.
It was a very enjoyable and entertaining lesson. Thanks again to professor @kouba01 for this nice lesson and to everyone who read my post.
CC: @kouba01