Candlestick Patterns - Steemit Crypto Academy Season 4 - Homework Post For Task- 10 by @acbaby
 Source Edited by @acbaby via iMark App

(1a) Explain the Japanese candlestick chart? (Original screenshot required).
(b) In your own words, Explain why the Japanese candlestick chart is the most used in the financial market.
(c) Describe a bullish and a bearish candle. Also, explain it's anatomy. (Original screenshot required).
Greetings fellow crypto students and Professors. I’m happy to do my last fixed beginners course homework today. This fixed course is about candlesticks patterns and how they aid in technique analysis in order to lead a trader to a successful trade. I will be answering the question in bold above where I will describe candlesticks and how to understand the bullish and bearish candle trends. Let’s start with my homework properly.
QUESTIONS 1a:
Explain the Japanese candlestick chart? (Original screenshot required).
In the thirst for executing successful trades, traders do a lot of technical analysis (TA) to ensure that they are actually minimizing losses and maximizing profits. Amongst the patterns and actions they use for TA is the Japanese candlestick chart. This idea of the Japanese candlestick pattern used as indicators for trading was brought about by a Japanese rice trader called Munchisa Homma. From when this system of trading indications were discovered, it only became more famous in the trading zone. This chat system is applicable for trading market prices of different stocks and commodities and in media such as Cryptocurrency and Forex.
The candlestick pattern helps traders know the immediate action pattern of the price depending on the actions taken by buyers and sellers in any market. From these chats a trader is able to tell if the market is bullish or bearish. These chart patterns are essential for every trader to have knowledge on, since it is a preliminary trading analysis. Starting to know that the red candle on a chart represents a bearish market and a green candle for a bullish market already gives a beginner a great understanding of rise and fall of market prices. This method of TA in couple with others will give a trader enough reason to enter or exit a trade. The screenshots below vividly describe a bullish and a bearish candle as seen on live chart as at the time of typing this exercise.
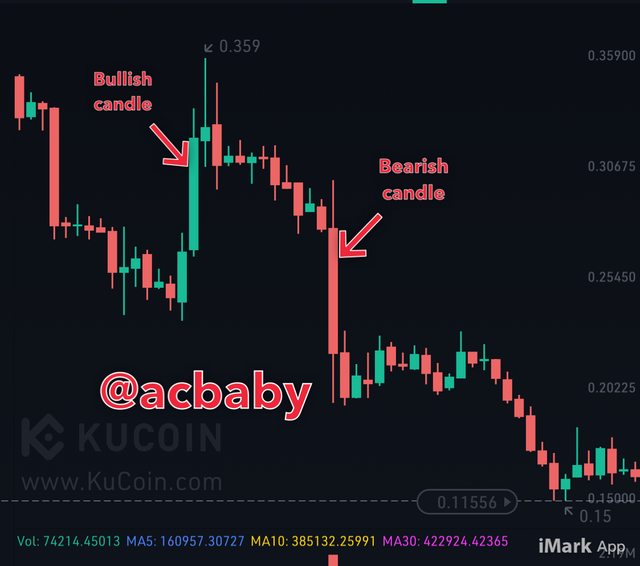
Source: KuCoin mobile App
Like I said above, we have green and red candles when it comes to the Japanese candlestick chart analysis. To know the type of trending market, a trader simply looks at the colors of various candlesticks and their trend. In a case where there are many green candles, it tells the trader the market was bullish at that time and the reverse is true. A professional trader, which I prefer to call an experienced trader, will make better use of these candlestick patterns than a beginner because there’s more to it than just red and green candles. The candle structures and features mean a lot in the decision making of a trader.
With the candlestick pattern chart a good trader standing on discipline can make a lot of profits by simply predicting market price and trend and applying them.
The most important parts of these two candle categories are their highs and lows, and their open and close. In the trading domain, the bullish and bearish candles have their significance depending on the area they are found on the overall chart, their sizes, wigs, open and close direction, and longer wig direction. All of these put together with other indicators will enable traders to make good trading decisions.
QUESTION 1b:
In your own words, Explain why the Japanese candlestick chart is the most used in the financial market.
The Japanese candlestick patterns help traders in so many ways. This has led to it being one of the most used for TA by traders. The reason behind this is that many testimonies have proved the system trustworthy and profitable if well followed. As a beginner I started trading based on candlestick charts and I made some successful trades but later had many losses because I depended only on this TA. It has been seen that due to the following added advantages this chart pattern has become the most used candlestick pattern in the trading world.
Easy to use
Applying the psychology behind the candlesticks chart is easy for beginners in the trading world and this is credited with the fact that it is easily understood.
Understandable for beginners
Knowing the basics of crypto trading means knowing the candlesticks chart patterns and this is a preliminary analysis and the easiest to understand. Other TAs are a little more complicated than the Japanese candlesticks charts. Beginners always find it easy to understand the green and red candles and their implications on different locations on the chart.
Helps in decision making
Using the Japanese candlesticks chart a trader will be able to detect price movements and the current trend of the cryptocurrency he/she is trading on for example. It helps with determining the uptrend (bullish market) and downtrend (bearish market) determination. After properly analyzing the charts, a trader can now make a good trading decision by entering with the right price and aiming to exit at the right price.
Minimize loss and maximize profits
Applying this chart pattern gives traders a green light on when to enter and exit a trade. One of the key points in making a good trade is to know when to enter and leave a trade. Being able to enter a trade at the right position and get out of the trade without liquidation is of great success to every trader and this is made easier by using the Japanese candlestick chart. Doing this enables traders to minimize losses while maximizing their gains.
Good for prediction
Experienced traders often use the Japanese candlesticks charts to predict prices from previous price movements of the same commodity or cryptocurrency they are trading on. This enables them to make good gains by placing successful long term and short term trades.
QUESTION 1c:
Describe a bullish and a bearish candle. Also, explain it's anatomy. (Original screenshot required).
The Japanese candlesticks chart is made up of the bearish (red) candles and the bullish (green) candles. To distinguish these two is of utmost importance. A trader can discover a good trading position on the downtrend by using the bearish candles and another trader discovers a good position in the uptrend direction using the bullish candle. Both ways make profits and also may cause losses if not well planned. The bullish candle signifies a time period where buyers have more pressure over sellers and a bearish candle signifies the opposite. Both candles have been well described below.
WHAT IS A BULLISH CANDLE
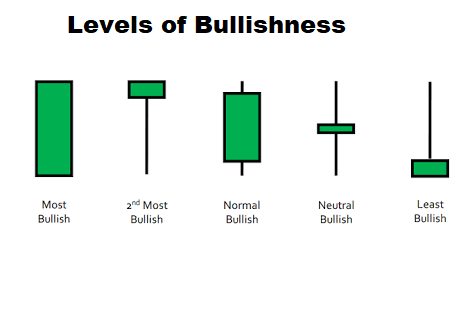
This is a candlestick that indicates an uptrend market price of a commodity or cryptocurrency. It exists in different forms but all indicative of an uptrend price movement. The photo below shows the different types of bullish candlesticks.
THE ANATOMY OF A BULLISH CANDLE
Generally candles have four different parts of importance to a trader. The bullish candle also has these parts. The bullish candle is green in colour and constitutes the same four important parts of a candle on a Japanese candlesticks chart. These parts include the following.
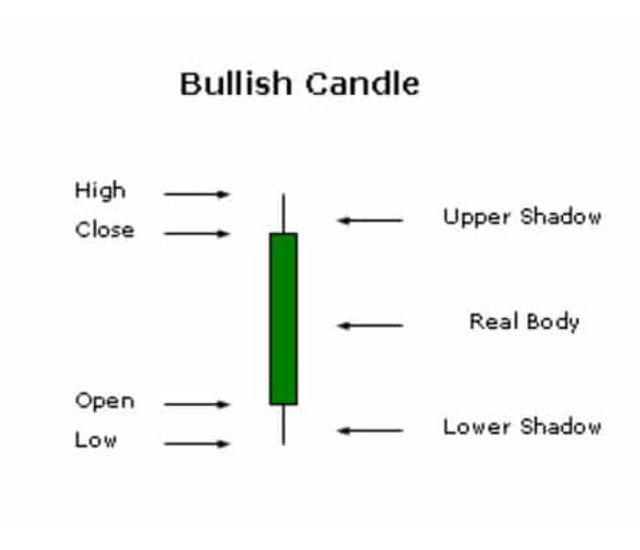
The Open
This is the opening price of a candlestick and it is marked by the close of the previous candlestick. On a particular time frame, this is the start up price at zero seconds.
The High
This is the highest price hit by a candlestick during the process of its formation. Irrespective of the candle type, this price is always seen at the top of the candlestick.
The Close
The close is the marked price at which the candlestick formation ended depending on the chart timeframe. On a 05 minutes chart, it is the price at which a candlestick reaches at immediately 05 minutes of its formation process which marks the Open of a new candle.
The Low
This part is called the low because it marks the lowest price a particular candlestick reached during the process of its formation. Depending on the time interval one is viewing a chart, the bullish candle at one point dipped to a certain amount which can be seen on the lower time frames charts as smaller bearish candles.
Generally knowing the marked prices of the various parts of a bullish candle tells a trader if the prices may go down or up as this affects the shape of the candlestick which is a very important thing to take note of. The bullish candle gives traders a clue of where and when the market is on an uptrend and where to “Buy long”. The screenshot below shows a bullish candlestick trend indicative of a bullish price movement.
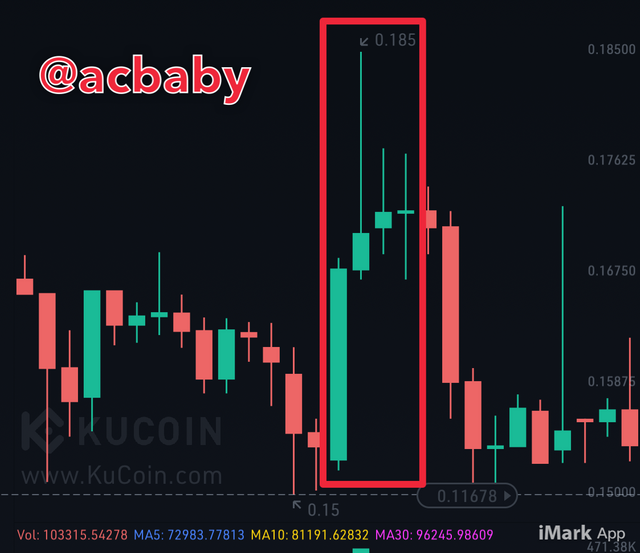
Source: KuCoin mobile App
WHAT IS A BEARISH CANDLESTICK
Bearish candlesticks are very useful in determining a downtrend in market price and also when they may be a price inversion during an uptrend. It is also one of the most important candlesticks on the Japanese candlestick charts.
The bearish candlestick is formally known as the red candlestick which describes a fall in price at a particular time frame. The photo below shows the different types of bearish candles.
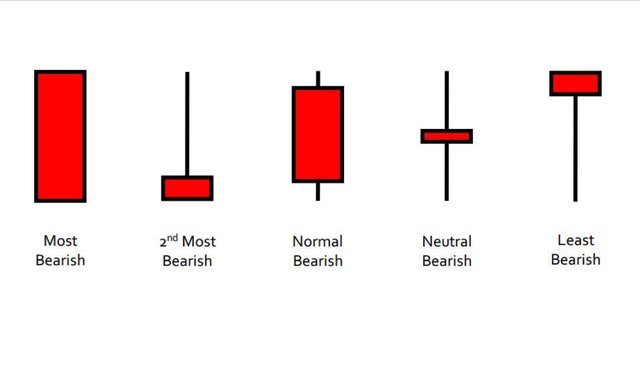
THE ANATOMY OF A BEARISH CANDLESTICK
It is made up of four different parts as the bullish candlestick does. Each part of this candle has its significance and generally the red candles end up with the buyers taking over the market. These parts will be explained below.
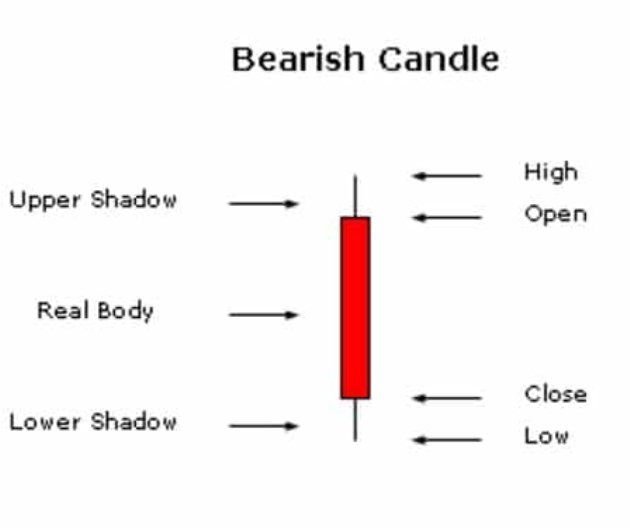
The Open
This is the start up price marked in the beginning of the formation process of a bearish candlestick. This begins from the zero second in the timeframe of formation of a particular bearish candlestick.
The High
The high of a bearish candlestick is the highest price met by the candlestick in its process of formation. Irrespective of the downtrend nature of a bearish candlestick, there’s fluctuation in prices within a given timeframe. A candlestick formed within 05 minutes must have a highest marked price which is know as “the high” of that candlestick.
The Close
The “close” refers to the last marked price made by a candlestick during its formation. This price marks the beginning of a new candlestick irrespective of types. In simple terms, the close is the open of a new candlestick.
The Low
The “low” marks the lowest price reached during the formation process of a bearish candlestick. Although a bearish candlestick signifies a downtrend in a particular time frame, within this time frame there’s fluctuation of prices and the lowest price reached is what is known as “the low”
Generally the bearish candlestick provides traders with sharp ideas on when to exist a “Buy Long” trade and when to enter a “Sell Short” trade. It also gives a general downtrend prediction.

Source: KuCoin mobile App
The screenshot below shows a bearish price trend indicating sellers pressure at a point in time.
The Japanese candlesticks charts are very essential for traders to use. This doesn’t guarantee that one can trade with only this TA but one has to involve other forms of TA such as trading volumes in order to make a better trading strategy. As a beginner I started trading using only the candlestick pattern and I made some profits but had more losses. It is advisable to add other analysis to the Japanese candlesticks charts before one commences with any trading activity especially when dealing with futures tradings.
Thanks to my professor @reminiscence01 for this wonderful lesson.
Thanks for reading
Steem on!