Steemit Crypto Academy Season 2-Week 8 | with Bollinger Bands by: @aboart
Introduction
After watching the lecture by lecturer @kouba01 I have put to test what I learned about Bollinger bands (BOLL) thanks to this tool I have learned more about trading and I have also been able to predict certain changes in some pairs, responding to the task recommended by the teacher from examples taken with my experience these days.
Define the Bollinger Bands indicator by explaining its calculation method, how does it work? and what is the best Bollinger Band setup?
Bollinger bands, developed by John Bollinger in 1980, these bands are a means of analyzing financial markets, specifically market volatility, thus providing a great deal of information to traders.
Bollinger bands consist of 3 lines drawn on the price chart, the central, upper and lower band.
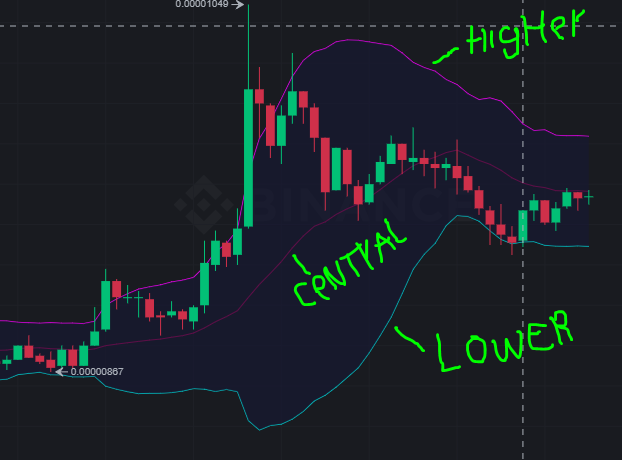
- The central line is a simple moving average, this is calculated with 20 periods.
- The upper line is calculated by adding the value of the simple mean 2 times the deviation of the moving average of 20 periods.
- The bottom line is calculated by subtracting the value of the simple average 2 times the deviation of the moving average of 20 periods.
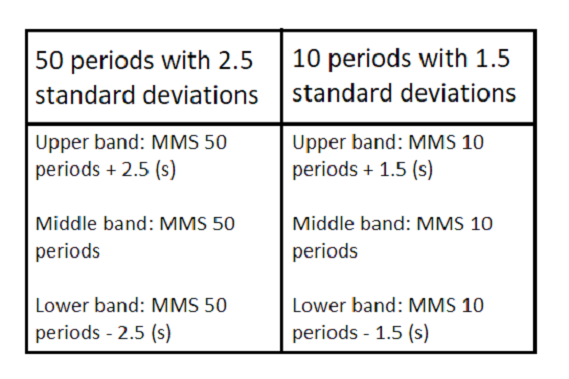
The best configuration for the Bollinger bands are those found by determined, calculating the simple moving line of 20 periods, multiplied by 2 the upper and lower lines, thus establishing the standard deviation.
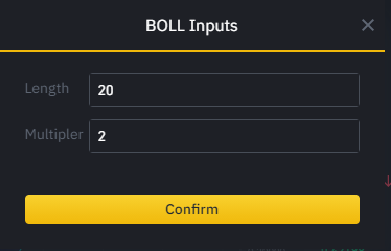
This configuration can change according to the number of periods established, however the most used is to calculate them in 20 periods multiplied by 2.
What is a breakout and how do you determine it?
A breakout is determined when the price candles break the lower or upper lines, these breakouts provide good information, thus determining where to buy and where to sell at the time of trading, these breakouts indicate to the buyer if an oversold or overbought is established.
How to use Bollinger bands with a trending market?
The bolliger bands generate a lot of information when buying and selling, as we mentioned in the breakouts, these can mark a trend state, either bullish or bearish, with these Bollinger bands different strategies can be generated, one of them It would be forming the figures W and M, the W indicates that there may be an upward trend while the M indicates the opposite, that the trend may be downward.
What is the best indicator to use with Bollinger Bands to make your trade more meaningful?
Undoubtedly, as we saw, the bolliger bands are a fairly considerable source of information when it comes to trading, but what would be the best indicator to use the bollinger bands? This question changes depending on the perspective of the person, in my opinion already put into practice it would be to complement the Bollinger bands with the RSI.
When the price rises breaking the upper band and the RSI exceeds 70, this indicates that there is an overbought, at this point the prices want to go down, which indicates that the best option is to sell.
When the price falls breaking the lower band and the RSI falls below 30, this indicates that there is an oversold, at this point the prices rise, which means that the best option is to buy.
What timeframe does the Bollinger Bands work best on?And why?
The bolliger bands in my personal opinion, works more in a short period of time, since they can be observed with more precision the volatility of the market, while in a long period it would be more difficult to predict a trend through the Bolliger bands since these tend to be less volatile so periods from 1m to 15m can be more effective.
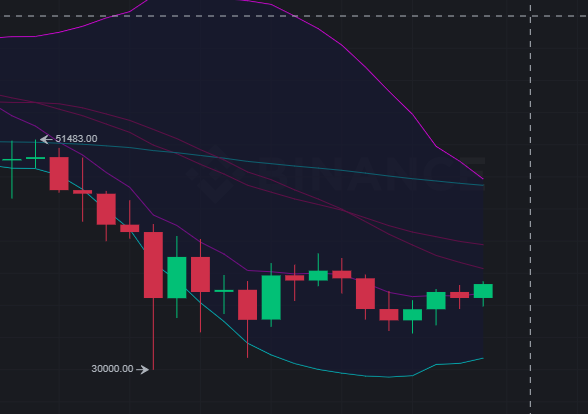
Sample of volatility in a period of 15 min.
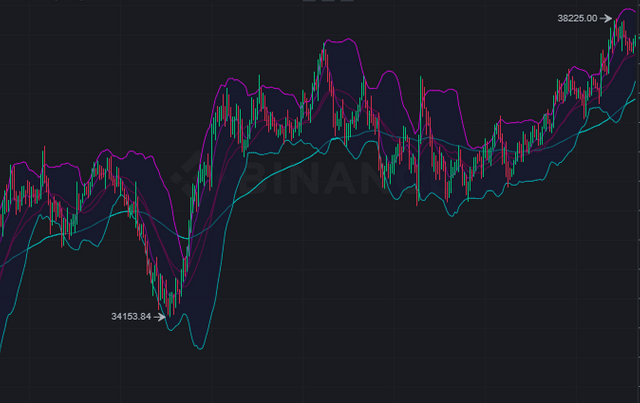
Sample of volatility in a period of 1 day.
Review the chart of any pair and present the various signals giving by the indicator Bollinger Bands.
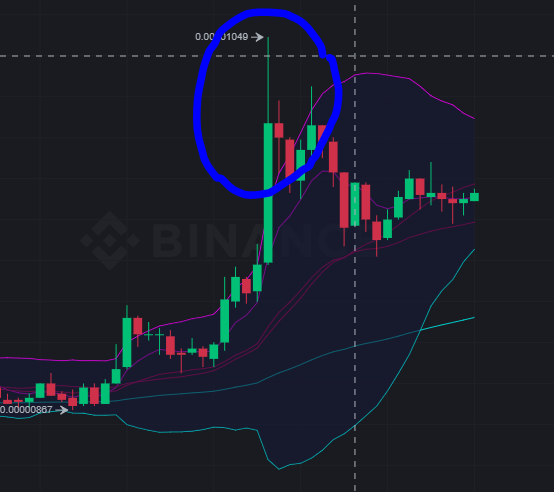
Now taking these fucking important into account, I will point out some indications that the bolliger bands show me, in this example I will take the SHIB/USDT pair.
SHIB/USDT chart June 2, 2021 time: 1:27 p.m.
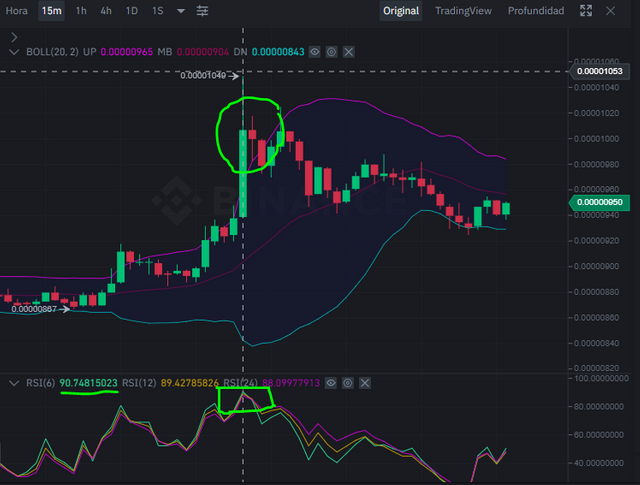
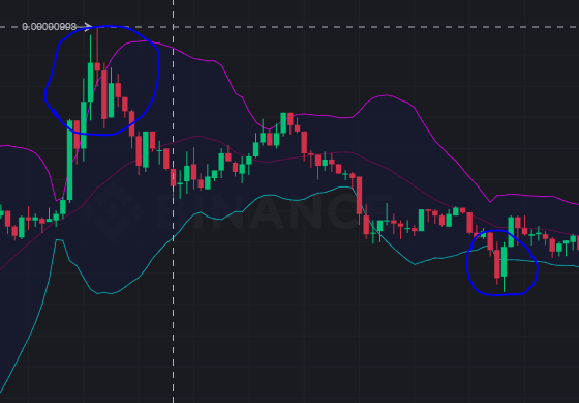
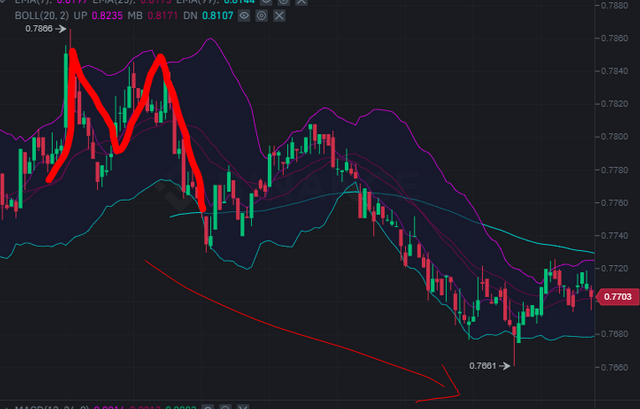
In this chart of 15 minutes, we can see that it had a break in the upper line, there being an overbought with an RSI of 90 thus making a downtrend.
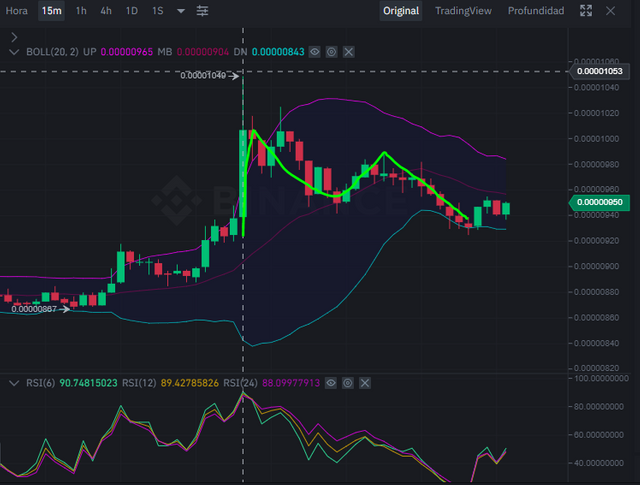
We can also see how the candles draw an M so the downtrend may extend a little more.
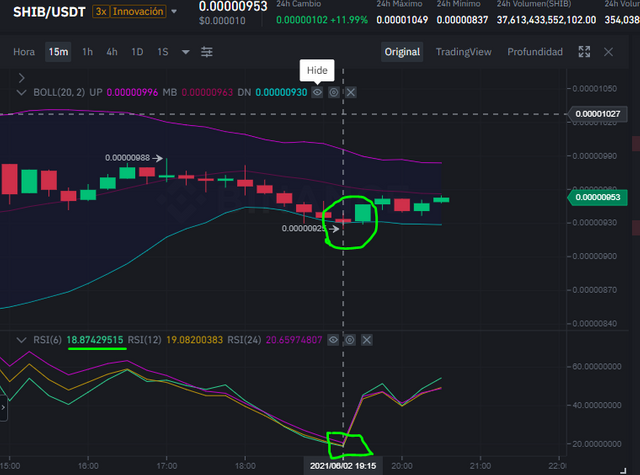
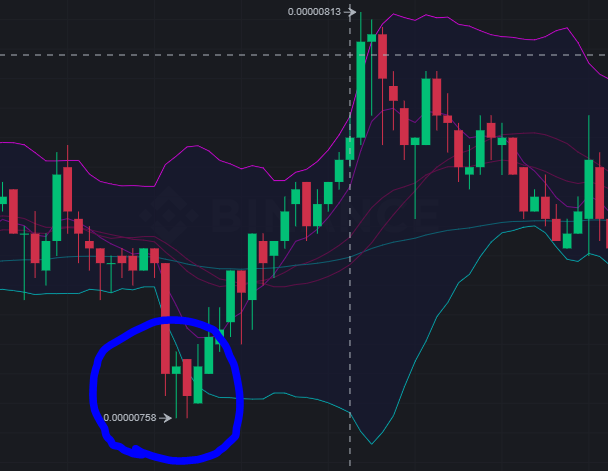
However, after falling, the price made a break in the lower line with an RSI of 18 marking an oversold and a possibility of a price rise.
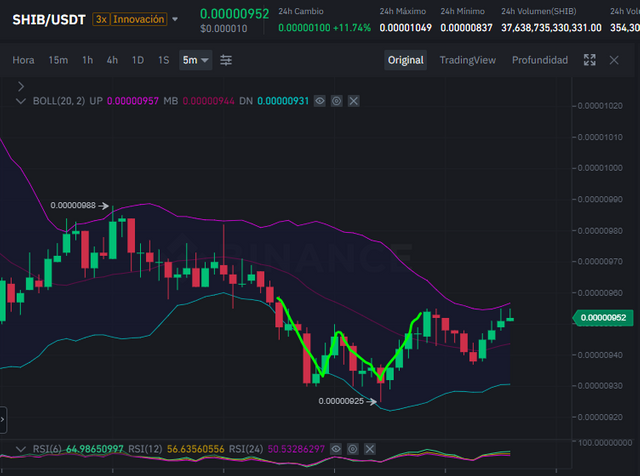
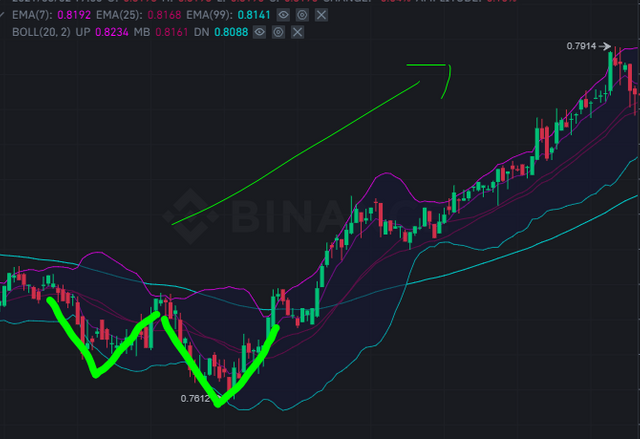
In the 5 minute chart we can see a W which could reinforce a possible rise in the SHIB/USDT.
Conclution
Knowing trading tools can be very effective when buying / selling, Bollinger bands have turned out to be a fantastic tool, being able to predict the events of the charts very well.
This has been my entire dedication, I take this opportunity to thank the teachers and Steemit Crypto Academy for the opportunity they present us.
@kouba01
I also want to mention to avoid confusion, in my profile my SP is shown at 127, however in my wallet the real SP is 185.