Steemit Crypto Academy Season 3 || Week 3 || Trends, Supports and Resistances and simple chart patterns || for @lenonmc21
Hello everyone. hope you all well and happy. Today my homework for professor @lenonmc21.
Thanks, Professor @lenonmc21

1.Define in your own words what is "Trend" and trend lines and what is their role in charts?
While this definition of the word “Trend” is apt, this definition does not apply to every niche out there. What we’re saying is that trends may differ in the social media world, while they will differ in the Financial markets.

Now, What does “Trend” mean in the Financial World?
In the financial markets, “trend” is a name given to a perceived tendency that may move in a specific direction over time.
To tell you in simpler words, the trend is a perceived tendency that makes it take its step in a specified direction.
Since we are on the topic of Trends, let’s talk about “Trend Lines”
What is a Trendline?
Traders use the term Trendline to define easily recognizable lines that they draw on charts to connect a series of prices together. This practice is also possible to show the best fit of specific data.
The traders later use this line to gain an idea of the direction in which investment might go in which the value of investment might move.
What is the Role of Trendlines in Charts
● Using trendlines, you can indicate the best fit of some data through a single line or a curve.
● A single trendline is applicable to a chart so that it gives a clearer picture of the trend in discussions.
● You can apply trendlines to the highs and the lows to create a channel.
2. Explain how to draw an uptrend line and a downtrend line (Show a screenshot of each).
Trend lines are the lines that traders draw at an angle above or below the price. People use them to give indications as to the trend and when the trend gets changed.
Moreover, they also serve as support and resistance and also provide opportunities to open and close positions.
How to Draw Trend Lines?
Here is a graph that shows an example of a downtrend and the uptrend line.
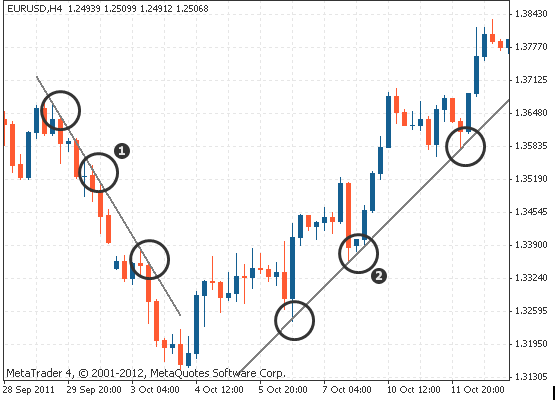
- You will notice that this graph shows swing highs on the downtrend.
- It also shows three swing lows on the uptrend.
So, here is a short tip when it comes to drawing trend lines. When you draw trend lines in a downtrend, you will draw them above the price.
As for the uptrend, you will draw these trends below the price.
3. Define in your own words what "Supports and Resistances are and how we can identify both zones (Show a screenshot of each one).
These two concepts of trading levels happen to be some of the highly discussed attributes of technical analysis.
These terms are an active part of analyzing chart patterns. Plus, traders also use these terms to refer to price levels on various charts acting as barriers.
These said obstacles prevent the price of an asset from falling in a certain direction.
If you want to identify them both, here is a short piece of information:
Support is a price level where a downtrend is expected on the basis of a concentration of the demand or the intent of buying. On the other hand, a resistance zone shows up due to the selling interest as soon as the prices increase.
4. Explain in your own words at least 2 simple chart patterns with screenshots.
Chart Patterns
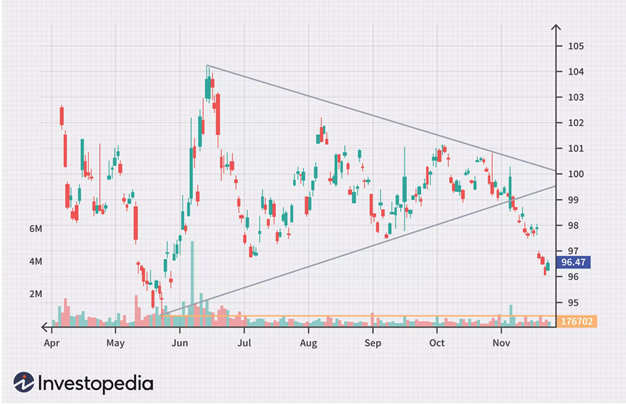
Triangles
Triangles happen to be the most used chart patterns we use in technical analysis. They are used in technical analysis as they show up more frequently as compared to the other chart patterns.
There are different types of triangles. Some of these include symmetrical triangles, ascending triangles, and descending triangles. You can expect these chart patterns to last anywhere from a couple of weeks to several months.
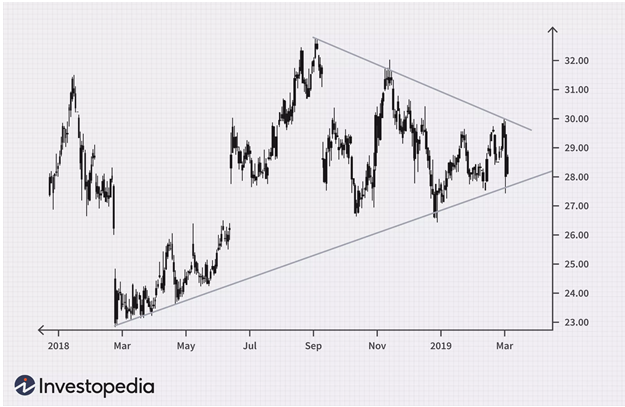
Wedges
Wedge is a kind of chart pattern that comes in handy when it comes to drawing converging trend lines.
However, you must know this important bit of information. A wedge is identified considering the fact that the said trend lines are moving in the same directions. This direction can either be down or upside.
If you see a wedge that is facing downwards, it is representing a pause during an uptrend. Comparatively, a wedge that is facing up shows a temporary interruption at the time in which the market is falling.
CONCLUSION
Here goes our article on Trends and what trendlines are.
We have tried to be as elaborate as possible in hopes of covering the most possible topics. This will help you in knowing all there is to know about Trends and Trendlines in the trading world.
Thanks To Professor @lenonmc21.
Such a nice post