Understanding Trends - Crypto Academy / S5W1- Homework Post for @reminiscence01

Trending in the crypto world doesn't necessarily mean popular like the word would implicate, but a particular movement over some time.
A Trending market simply means the market is moving in a particular direction, this movement might be an uptrend/bullish movement or a downtrend/bearish movement.
However, most people think the Trending market is all about the market experiencing a bullish movement forgetting the fact that there's a downtrend.
The direction of the market is dictated by the battle of demand and supply induced by crypto investors.
A trend is the make or break of any person into crypto trading, reading and analyzing it well would lead to profits, and miss reading it could lead to loss.
As I spoke of the Trending market earlier, I made mention of how the market could move in a particular direction.
A bullish trend is also a market trend which means that the market is moving in an upward manner. When you look at a market chart of a cryptocurrency that is in a bullish trend, you'll find the value of that particular asset moving in an upward manner.
When there is a high demand for an asset but less supply, then the value of the asset will increase, in this sense an uptrend.
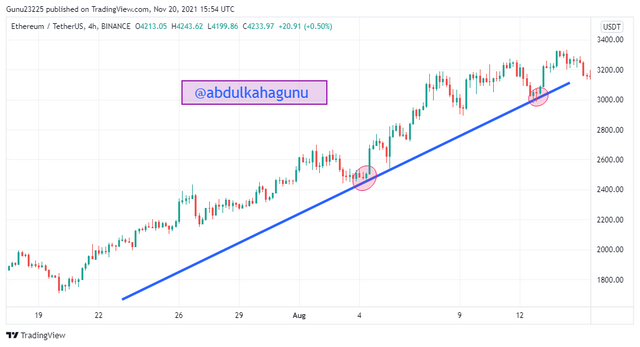
An example of a bullish trend is as follows.
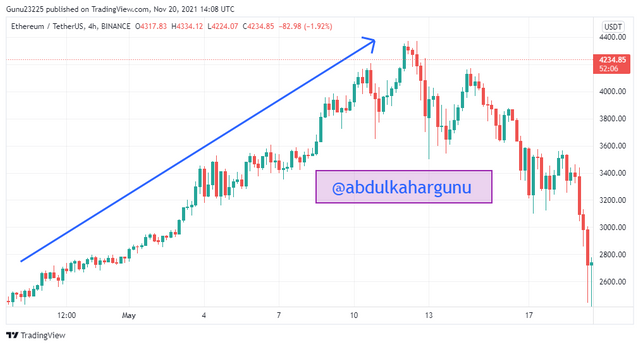 ETHUSDT chart: Bullish trendSource
As I said earlier, just as bullish trend means upward movement, and bearish trend means a downward movement.
This happens when there's less demand for an asset. When this happens, the value of any asset depreciates or experiences what is called a bearish trend.
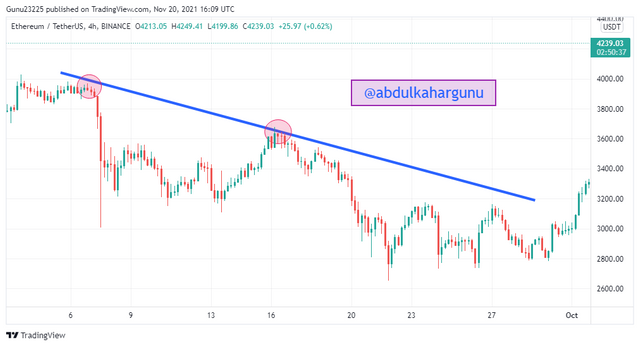
An example of a bullish trend is as follows.
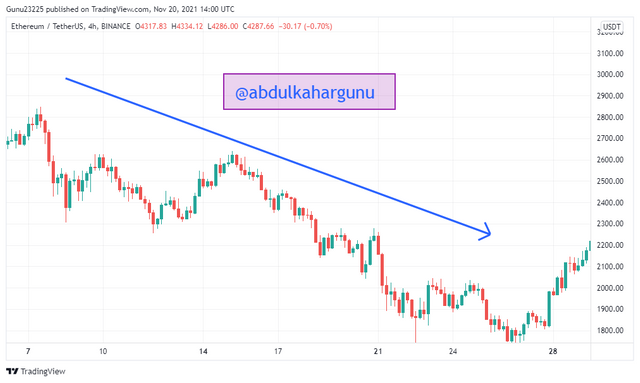 ETHUSDT chart: Bearish trend Source
2) Explain the following trend identification and give an example of each of them. (Original screenshot needed from your chart). Do this for a bullish and a bearish trend.
i) Market Structure.
ii) Trendlines.
Market Structure is a way that's used to identify the current direction of an asset. It is used to deduce whether an asset is experiencing:
- Bullish trend
- Bearish trend
- Ranging
Bullish Trend
In a bullish trend, the value of any asset must be moving in an upward manner. This means it must be making Higher-highs and lower-lows. In simple terms, the prices must rise more than the previous higher-high and not fall below the previous Higher-low.
One can say that for instance, an uptrend begins from point A to B to C (let's take these as the Higher- highs) with lower-lows of X to Y to Z. The uptrend simply means that when you compare Higher-highs point A to B, you will realize that point B will be higher, also, if you compare point B to C, point C will be higher.
If you take the lower-lows too, comparing point X to Y, you'll realize point Y is higher, also comparing point Y to Z, you'll realize point Z will be higher.
Basically, an uptrend is all about moving upwards.
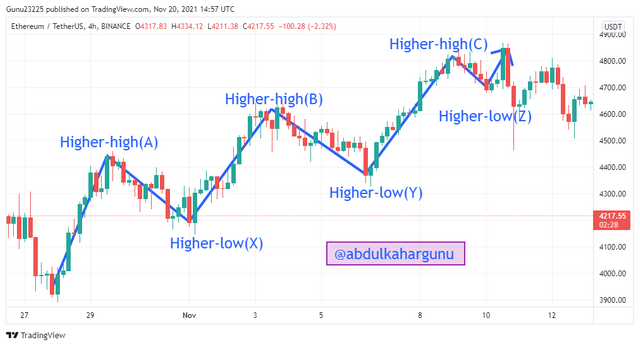 ETHUSDT chart: Market structure | Bullish trend Source
Bearish Trend
In a bearish trend, prices will be observed to be moving downward. Just like the way and bullish trend moves, a bearish trend works in the exact opposite way. It makes lower-highs and lower-lows formations. That's to say, the first lower-high will be higher than the second lower-high, which will then be higher than the next lower-high, in that order. Also, the first lower-low will be higher than the second lower-low, which will then be higher than the next lower-low.
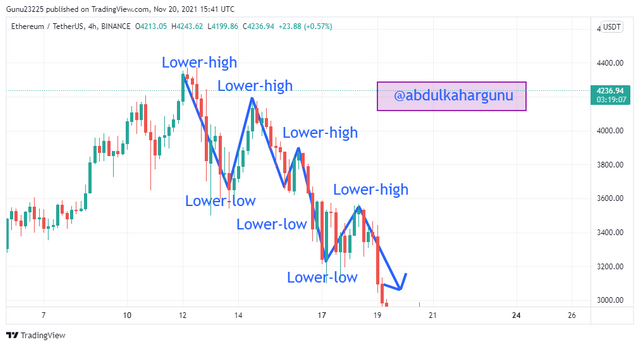 ETHUSDT chart: Bearish trend Source
Trendlines are another way one can use to identify the current direction of a market.
It works by drawing a slanted line to meet two points, two low points for an uptrend, or two high points for a downtrend.
The trend is valid once the line is not broken by prices making extreme upward or downward movement.
Bullish Trendline
Using trendline to locate a bullish trend, a line is drawn to meet two points called low points. Low points here mean that a line will be drawn below the uptrend part of a chart in a way that will seem that it touches the extreme downtrend part of the uptrend.
Once the line is drawn, you'll see prices not going below the line, once there is a price breaking the line extremely, it nullifies the trendline. Basically, prices will be above the trendline.
An example of a bullish trendline can be observed below.
ETHUSDT chart: Bullish trendline Source
Bearish Trendline
Just like the bullish trendline, the line is drawn alright, but it is drawn above the prices.
You'll realize prices not moving the line, but might be bouncing on the line. If prices move above it then it nullifies the current trend.
ETHUSDT chart: Bearish trendline Source
3) Explain trend continuation and how to spot them using market structure and trendlines. (Screenshot needed). Do this for both bullish and bearish trends.
During a trend, say uptrend, the market is said to be moving upwards, but the catch is that it does not move upward like a vertical line or straight downward in a downtrend.
There are mostly little uptrends and downtrends found in the main uptrend or downtrend. That's to say that be it a bullish trend or bearish trend, you'll find prices moving upwards and downwards in it.
Using market structure to determine the trend continuation of a market requires one to have some knowledge of identifying trend movement.
Basically, they both follow the same principle of Higher-highs, Higher-lows, and lower-highs, lower-lows.
Bullish Trend
During an uptrend, there'll naturally be Higher-highs and Higher-lows, the creation of the Higher-lows are what's called retracements, these are results of traders taking profits. It also serves as an entry point for traders.
Points to note is that:
- The next Higher-high must be above the previous Higher-high.
- The next Higher-high must be above the previous Higher-low.
- If there is an extreme price that breaks the Higher-low, then the trend continuation is nullified.
The logic's that, it must be moving upwards, from low grounds to high grounds.
ETHUSDT chart: Bullish trend continuation Source Bearish Trend
Just like the bullish trend, the bearish trend is the opposite way of it. It has Lower-highs and lower- lows. The thing about it is that it moves downward.
Points to note about the bearish trend:
- The next Lower-high must be lower than the previous Lower-high.
- The next Lower-low should not be higher than the previous Lower-low.
- If there is an extreme price that breaks the Higher-low, then the trend continuation is nullified.
The logic's that, it must be moving downwards, from high grounds to low grounds.
ETHUSDT chart: Bearish trend continuation Source
Bullish Trend
To spot a bullish or uptrend with a trendline, a line is drawn to meet two low points.
You'll realize all prices will be above the trendline or bouncing off the trendline.
It basically feels like a ball bouncing off the ground and moving forward. Prices move up, retrace, and bounce off the trendline, however, once prices fail to bounce off the line but move below it, then it violates The current trend.
ETHUSDT chart: Bullish trendline continuation Source
Bearish Trend
Spotting a bearish trend is the same as spotting a bullish trend as explained earlier, just that, in this situation and a line is drawn to meet two high points.
Prices will either be bouncing off the line or attempting to reach it. Once prices does not go above the trendline extremely, then the current trend is maintained.
ETHUSDT chart: Bearish trendline continuation Source
Pick up any crypto-asset chart and answer the following questions -
i) Is the market trending?
ii) What is the current market trend? (Use the chart to back up your answers)
The crypto asset I’ll be analyzing is SHIB.
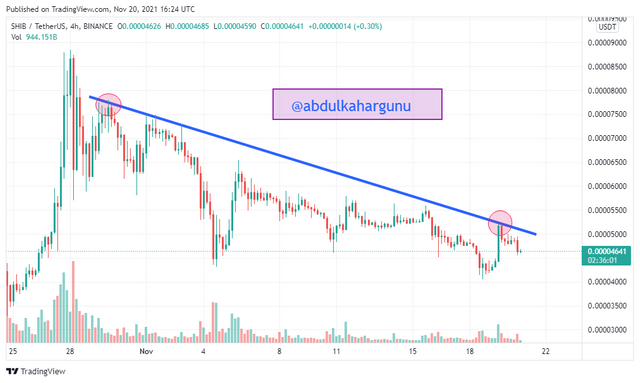 SHIBUSDT chart: Bullish trendline Source
From the SHIBUSDT chart above(4-hour), it clearly shows that market is moving in a certain direction, hence it is trending.
From the chart, we also notice how the prices are moving downward and either bouncing off the trendline or failing to break it. This shows how the SHIBUSDT is in a bearish direction.
The movement of the market is the make or break of every crypto trader. So a trader must know how to determine the direction of the market, one of the ways to do that is to use the market structure method, this way, a trader will have at least something to depend on before making a trade instead of going in head strong.
Cc-
@reminiscence01
Hello @abdulkahargunu , I’m glad you participated in the 1st week Season 5 of the Beginner’s class at the Steemit Crypto Academy. Your grades in this task are as follows:
Recommendation / Feedback:
Thank you for participating in this homework task.
Thanks prof
Bringing in more energy