[Psychology of Trends Cycle] - Crypto Academy / S6W4- Homework Post for professor @reminiscence01

Hello, fellow steemians,
Hope you all are doing good?? My regards to professor @reminiscence01 for organizing this lecture. As we all know, to be able to make a profit in the trading market, a trader has to be able to read and understand the market trends, that is whether the trend is bullish or bearish in other to capitalize on the market.
Q1. Explain your understanding of the Dow Jones Theory. Do you think Dow Jones Theory is Important in technical analysis?
The Dow theory is one of the early theories of market trend observation which was developed in early 1897 by a humble journalist of the name Charles Dow. The Dow theory is also the earliest technical analysis theory is that currently used in the trading world today. Dow's theory was derived based on the effects of various surrounding factors be it economic news, to supply and demand. Now Dow observed that the market trend moves upward or downward and realized that the various factors surrounding the market are discounted prices to the market. So according to the Dows theory, analyzing the prices can play a key part in predicting the trends of the market.
The factors like supply and demand according to Dows theory can be used to determine the trend of the market, whether it is going to be a bullish or bearish trend. For instance, when there is a higher demand for an asset or a stock, one can predict the trend is going to be a bullish trend, from the price discount from that asset or stock and also when there is a low demand for an asset or stock in the market, it will also reflect the price discount of the asset or stock which will depict a bearish trend.
Same with the economic news as a factor for predicting trends, one can analyze from news of companies performance on what to expect which can help predict the trend. For instance, if there is going to be a merger between two big companies and the news get out one can assume the amount of profit those two companies stand to make together it will derive demand of the product or stocks of those companies producing a bullish trend in the market for that product or stock.
YES. I sincerely think that Dow jones's theory is important in technical analysis. I say this because I think his idea created the basis on which these modern technical analyses operate. With this theory there is no chance to misinterpret a movement reading once the information is verified and unlike with modern analysis tools where the Whales can manipulate the market to mislead traders to capitalize on their losses. The theory is clearly proven and is very useful for a very long time even now once the demand of an asset is high it denotes an uptrend or bullish trend and when the demand of an asset is low, it also denotes a downtrend or bearish trend
Q2. In your own words, explain the psychology behind the Accumulation and Distribution phases of the market. (Screenshots required).
This phase of the market involves the rigging of trend movements, the trend is usually triggered to move in a particular direction either bullish or bearish and in this light, retail traders jump in to savor some profit which due to FOMO(fear of missing out) and when this happens, the market trend instantly take a reverse trend contradicting the retail traders' predictions and then the big players then turn to profit of the losses of the retail traders. These big players manipulating the market are known as Whales. They own huge chunks of the asset so they are able to manipulate the market in their own favor.
So basically in the accumulation phase, once the whales invest in the asset there is always an uptrend just as the Dow Jones theory states, when the demand of an asset is high it results in a bullish trend.
After the accumulation phase occurs, if the big investors are not satisfied with their profits, they can manipulate the market to cause something called reaccumulation. After an accumulation stage, retail investors start to buy into the asset because of the bullish trend but the whales can cause reaccumulation to make more profits by selling assets to drive the trend downward which will scare retail traders of losing then they will have to sell low and cut their losses which the whales will capitalize on by buying in big into the asset to cause the reaccumulation.
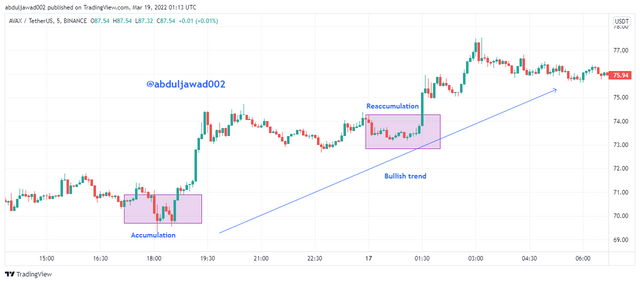
Screenshot from Tradingview
From the screenshot above, we can see that after the accumulation point the trend started moving upward or bullish till it took a dive as if it was changing a movement forcing retail traders to sell, and then the market rises up again with the what making the profit after reaccumulation.
The distribution phase implies the exact opposite of the accumulation phase. In this phase, the big players in the market, (the whales), as they invest in the asset to make the trend move upward or bullish creating a trend for retail users to buy into the asset, and when they feel like they have made enough profit, they decided to sell driving the market downward and bearish and small-time traders making big losses. The distribution phase involves the whales selling their assets to force the market into a downward trend instead of upward like accumulation. Just like the accumulation phase, the big investors can also cause a redistribution of the trend, that is deceiving small traders that the trend is going up and for a short time comes down again just like that to make the big time investors more profits.
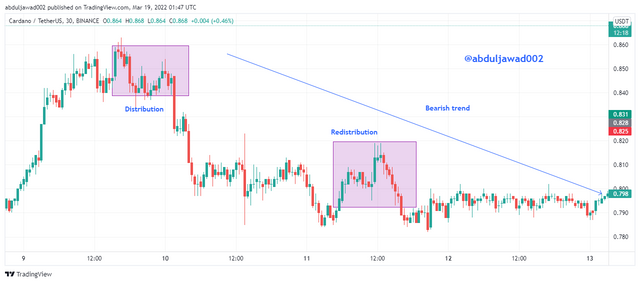
Screenshot from Tradingview
From the screenshot above, you can see that from the distribution point, the trend started falling and started to rise before the redistribution point but then fell into a bearish trend again.
Q3. Explain the 3 phases of the market and how they can be identified on the chart.
A market is known to be bullish when there are a series of higher highs and higher lows involved in the movement of an asset. This movement creates the opportunity for traders to buy into the asset at that point to make a profit. The bullish market is also known as an uptrend movement of the market. This is caused by the high demand for the asset and according to Dow jones's theory the higher the demand in an asset the more the trend moves upward or the trend is bullish. Graphically a bullish trend is supposed to denote a zig-zag pattern movement in its trend when connecting the higher highs and the higher lows in the chart.
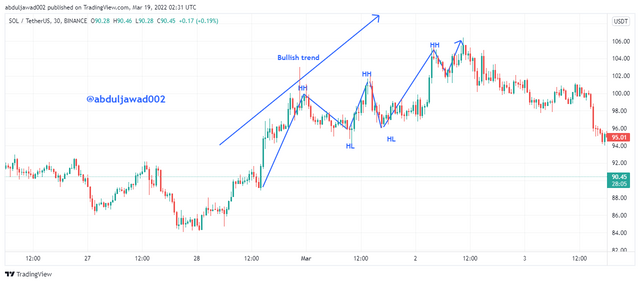
Screenshot from Tradingview
From the screenshot above, you can see that the trend of higher highs(HH) and higher lows(HL) forming a zig-zag pattern moving upward. That signifies a bullish trend.
Bearish markets are also sometimes referred to as downtrend movements. When there is a bearish movement in the market it causes traders to cut their losses and sell their assets or risk losing their assets or some of it. The bearish movement is denoted by the downward movement of some lower highs and lower lows forming a zig-zag pattern movement downward. According to dow jones's theory, there's a downward movement of an asset if that asset is low in demand then there is going to be a downward trend in the market. It also denotes the supply of that asset and the price discount of it.
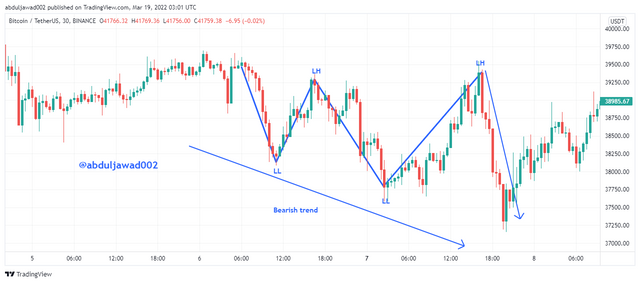
Screenshot from Tradingview
From the screenshot above, you can see how the lower highs and the lower lows create a downward zig-zag pattern on the chart. That only signifies a bearish trend.
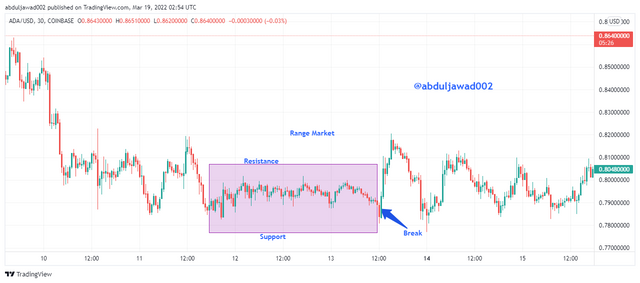
The sideways market is known for its volatility and inconsistency. With the sideways market, there are no clear trends found in the market, rather the rising and falling of the in an asynchronous manner, which means it has no sense of direction or it does not move toward one specific direction. The sideway market is also known as the ranging market. When a sideways trend breakout, the breakout determines whether the price is reversing or in continuation of its original movement.
Screenshot from Tradingview
From the screenshot above, you can see clearly what I stated early, we can see the sideway trend and where the trend is moving toward right after the break.
Q4. Explain the importance of the Volume indicator. How does volume confirm a trend? Do this for the 3 phases of the market (Screenshots required).
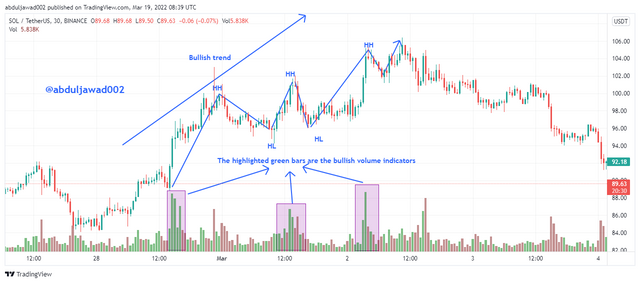
As we said earlier, how various factors like economic news, demand, and supply affect the movement and prediction of the market, and we also made mention that all those factors affect the asset or product for a discount price. The volume indicator shows the amount of the assets being bought and sold in real-time and displays the movements. In a market, during an uptrend or a bullish trend, there is a high volatility of the asset which results in an increase in the volume of the asset to support the breakout in the new uptrend.
Screenshot from Tradingview
From the screenshot above, we can see that there is a spike in the volume trend caused by the volatility in the uptrend at that point. The higher the volatility of the trend the higher the volume.
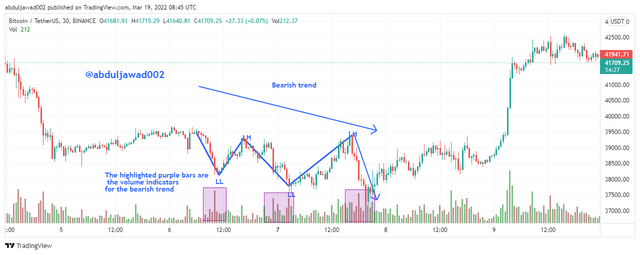
The bearish market is also affected by the same factors as the bullish trend but in the opposite direction. In a downtrend or a bearish trend, a factor like the whales can cause high volatility in the market which will increase the volume of the asset. When the whales decide to change the market moves into a downtrend, and there is a huge sell of the asset, the is going to be high volatility in the asset which will increase the volume of the asset.
Screenshot from Tradingview
From the screenshot above, you can see that the highest volume of the bearish trend matches to how steep the market of that asset has been manipulated to fall.
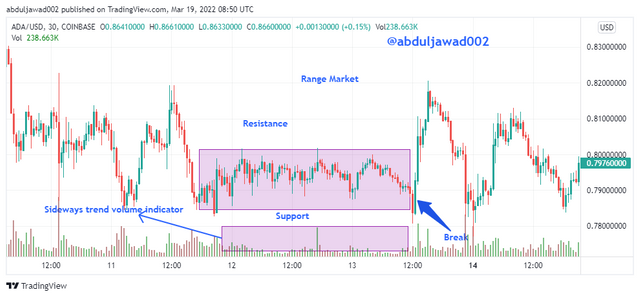
The sideways market as I implied earlier is a point in the market where the trend is neither bullish nor bearish, which means that the buying and selling of the asset are equally creating an equal trend, and just like the bullish and bearish trends, the volume indicator shows the volatility of the sideways market too.
Screenshot from Tradingview
So from the screenshot above, you can realize that because there was a change in the trend in any direction, the volume also remains the same as can be seen in the image.
Q5. Explain the trade criteria for the three phases of the market. (show screenshots).
There are other criteria and specific things a reader should take notice of when trading apart from being able to read and understand the market trends. I will enlighten you on some criteria to consider or meet when trading.
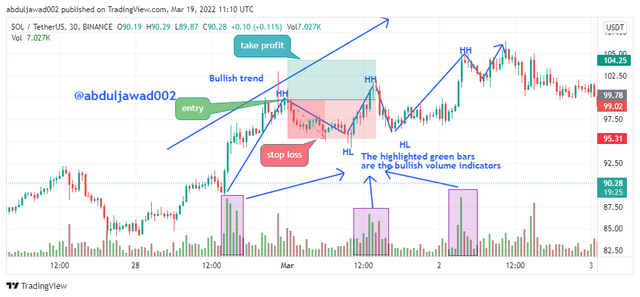
First of all the most important criteria to meet is to make sure that the market of that asset is in an uptrend or a bullish trend of higher highs and higher lows and also supported by the volume of that asset to beware of traps set by the big investor for us to fall into.
Secondly, you have to wait for the price to make a retracement trend. This implies we wait patiently for the trend create another higher high as it should then we can make our entry in the next higher low to coming. Then we can execute our buy option to purchase the asset.
The next thing to do is to make sure that the risk-reward ratio for the stoploss for the position we entered should be 1:1 or 1:2 and placed below the low point of the retracment trend.
Screenshot from Tradingview
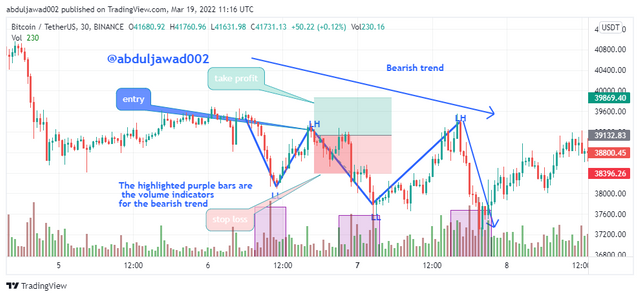
The first criteria to observe and fulfil as it is the key criteria is to make sure that the market trend is in a downward treand or a bearish trend, that means the charts should be creating a series of lower highs and lower lows backed with an increasing volume.
Secondly, the other thing to do is to wait for the price to create a retracement trend which will form a high point and once the price creates another lower low after a lower high, we then execute our sell order or position.
Lastly and most importantly, we have to make sure that the stop loss and take profit for the sell position has a risk-reward ratio of 1:1 or 1:2 and placed below the hight point of the retracement trend.
Screenshot from Tradingview
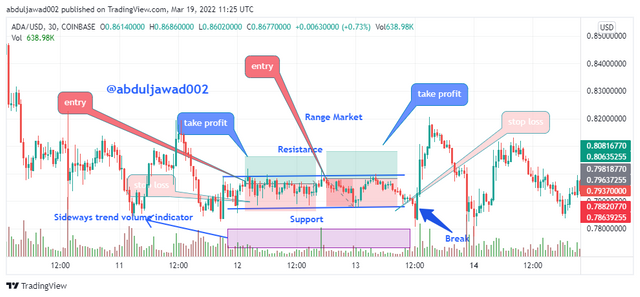
Trading with sideways trend is a bit complex than that of trading with either bullish or bearish trends because it is hard to determine where the trend will move towards next and more caution is always advised when trading with sideways trends. You have to make sure that the bullish and bearish pattern are present before you make your entry.
When trading with sideways trend, first of all you have to identify the resistance and the support range. When you discover them, you can open a buy order or position at the support level with the stoploss placed below the support level and the take profit is placed at the resistance level. The same way you can then open a sell order or position at the resistance with the stoploss of placed above the resistance and the take profit is also placed at the support level.
Screenshot from Tradingview
Q6. With the Trade criteria discussed in the previous question, open a demo trade for both Buy/ Sell positions.
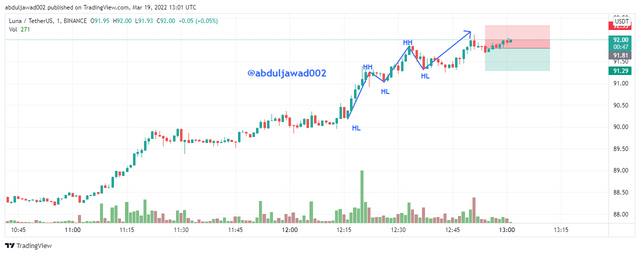
Before I execute my buy order or position, I made sure that the trend was bullish like I stated early which means there are a series of higher high and higher and higher low moving in an upward trend. Now I have to wait for the chart to make a retracement trend, then I now make my entry on the higher low at the retracement point as shown in the screenshot below. I will be using LUNAUSDT to explain.
Screenshot from Tradingview
From the screenshot above, you can see that i entered a long position with my take profit at $92.51 and my stop loss at $91.51. And after placing my buy order and it running of papertrading my order was finally fulfilled and i made a profit of $1.70.

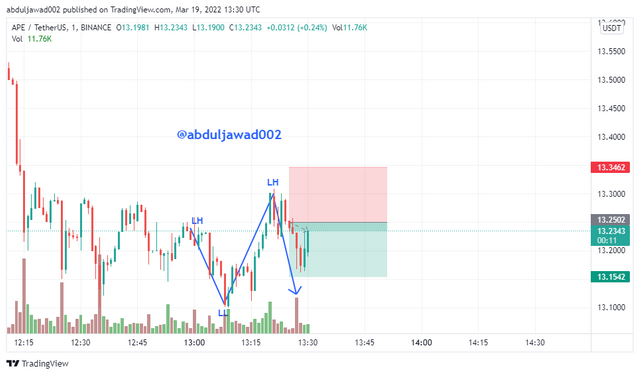
Just like executing my buy order, i have to go through the same process with the sell order but first instead of looking for bullish movement, i will be observing for bearish movements rather. Once i see a bearish trend, i will have to wait for the price to also make a retracement trend and then after i make my sell entry position.
Screenshot from Tradingview
From the screenshot above, you can see the point at which i made my entry and can also see that the trend was bearish and made a retracement trend. So i made my entry with a take profit of $13.2502 and a stop loss at $13.3462 and after my order had been running through papertrading for a while my order was finally filled and my risk reward ratio was 1:1.

Finally a screenshot showing that all my orders are fully filled.

Conclusion.
I must really commend professor @reminiscence01 for this lecture. I have really gained a real insight into trading and trend observation and i feel really good about m self for knowing and i honestly will need this insight in trading.
The Dow jones theory surely is a really great theory for it has proven to be relied in many way. It has single out the corelation between factors like economic news, demand and supply with the movements of assets in the market and the volumes of those asset as they are demanded more causing an uptrend and also reflects the volume of the assets being traded.
This lecture has been really helpful to me and i couldn't be more honoured to participate in it. I send my regards to professor @reminiscence01 for organizing this great lecture, i hope to learn more.
Thank you.