Puria Method Indicative Strategy- Steemit Crypto Academy- S5W4-Homework post for @utsavsaxena11. by @abdu.navi03
Hello everyone how are you all doing? I hope fine. I warmly welcome you to the fourth week of the 5th season. This is my first beginner's course of this season.
In this lecture by Professor @utsavsaxena11 , we learned the basics of Puria Indicative strategy and how to make your own strategy


PURIA INDICATIVE STRATEGY
It's a strategy for both newbie and experienced traders and especially for those who are intraday traders. It is very easy to understand and very easy to apply. By this strategy, traders can be in always be in profit by proper risk management. All this strategy needs is a good asset following chart trends because this strategy is based upon trends. So as long a mysterious dump or bull hasn’t come into the market this strategy makes your portfolio green all the way.
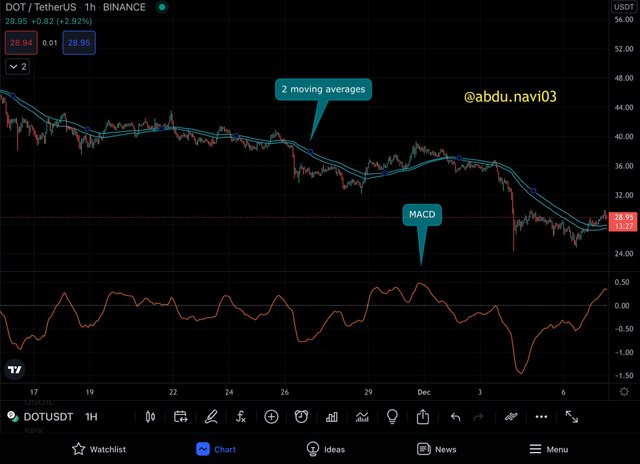
In this strategy, as the professor explained there are three indicators are used. Which are 2 moving averages and MACD. Of course like any other indicator, especially any other moving average, before using setting it up for your preference is necessary, likewise, it is necessary to set up properly our these three indicators for using this strategy perfectly and have a green portfolio.

MAIN SETTINGS
For setting up the first moving average we will go to the indicators section and choose the indicator, after choosing it wee will go to its setting which must be present on the left-hand side in tradingview
By going there we’ll found;
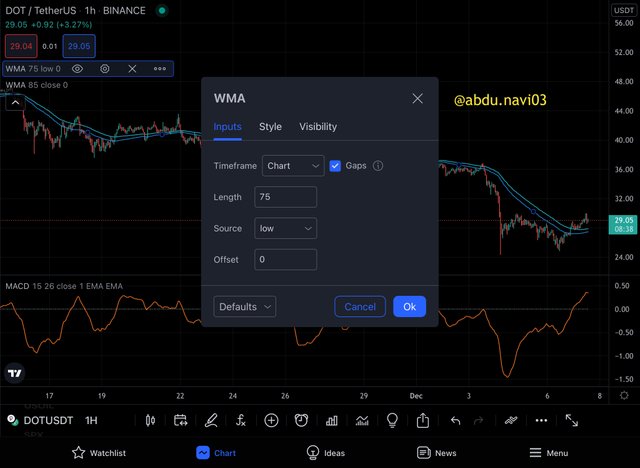
As you can see we changed the two out of three most important things from moving average. For moving average time frame, source and length are the most important settings. The default length was 09 and we changed it to 75 while the default source was close, we changed it to low keeping the time frame unchanged.
In the above screenshot you can see we changed the 2nd moving average and changed only its default length from 09 to 85, while we keep the source as close and the time frame unchanged
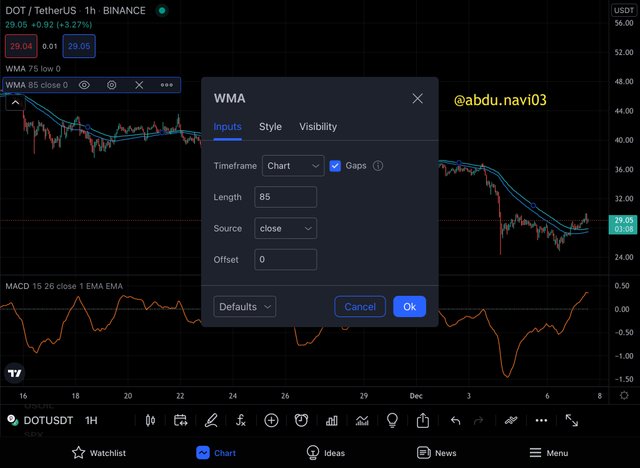
In the above screenshot, you can see we changed the 2nd moving average and changed only its default length from 09 to 85, while we keep the source as close and the time frame unchanged.
The setting of MACD is pretty important in this strategy as its the key indicator.
When you apply MACD you’d see a line with some candles in the bottom telling upper and lower volumes, then we’ll go into its second and change them into this;
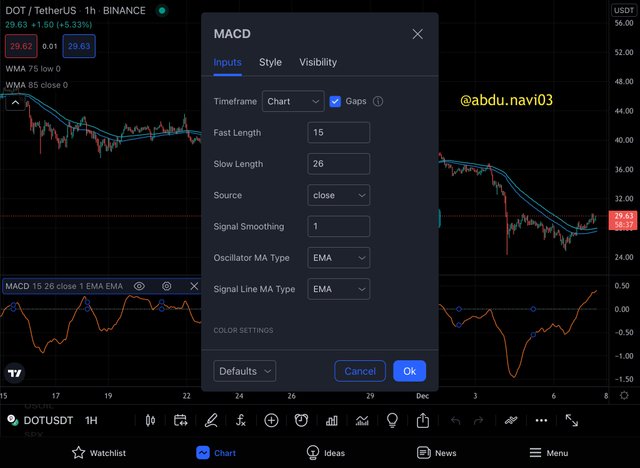
In this setting, you can see the fast length is 15 and slow length is 26 meanwhile we also changed its signal smoothing to 1, making sure to keep every other thing unchanged.
When you’ll apply these settings you see your candles will vanish and you are seeing a single line
As you put everything together we are ready to use our strategy. For using we must first study the signal from MACD. The signal from MACD is simple enough. Let me elaborate with a screenshot
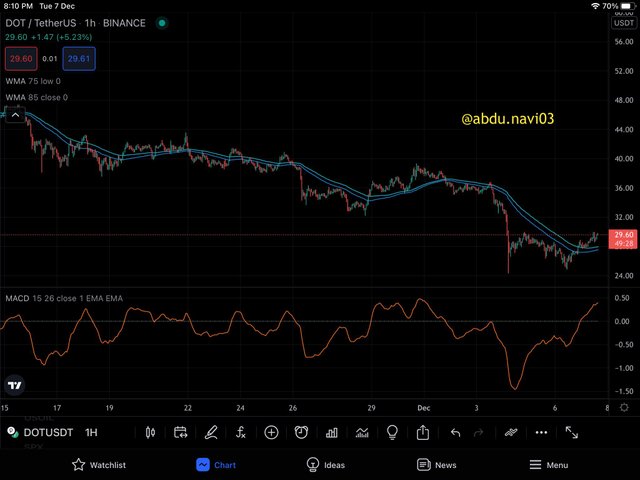
In this screenshot, you can clearly see that MACD has two portions.
~ the First one is above the zero(0)
~ the Second one is below the zero (0)
We can read a bullish signal when the line of MACD intersects with 0 coming from the portion below the zero. But that’s not it. Here are our moving averages come into play, when a line of MACD intersects with a line of zero then we have to wait until a green candle or two successive green candles also intersect and cross our set up moving averages. It tells us about a bullish signal upcoming.
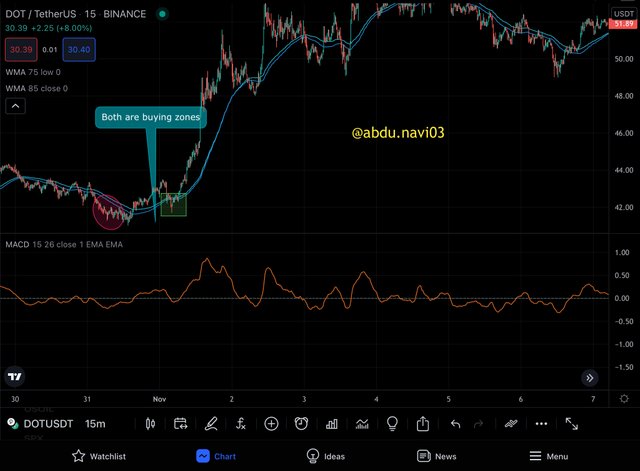
As you can see in the chart of DOTUSDT from tradingview MACD not only tell us accurate entry position but make us ready for it by giving the signal, as a trader gets the signal his/her attention shifts towards the moving averages. In this chart, as it happens both intersections, a bullish trend start and we get out perfect eatery with targets and stop losses
We can read a bearish signal by this strategy whenever the line of MACD intersects with the line of 0 such as the line of MACD coming from the upward portion of the 0 lines. As you know that’s not it, for a bearish signal red candle must also intersect with the moving average line and cross it. It tells us the upcoming bearish trend
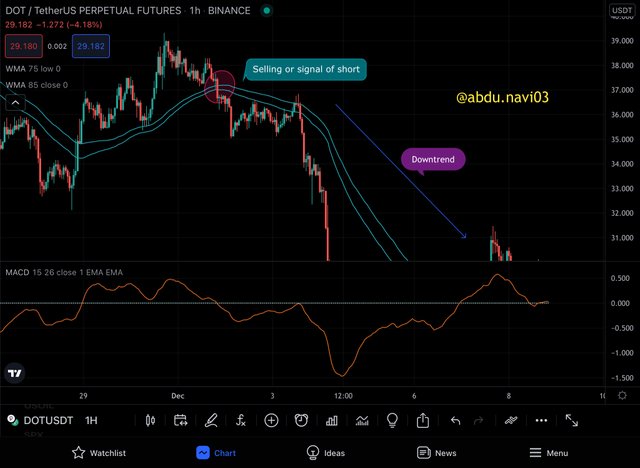
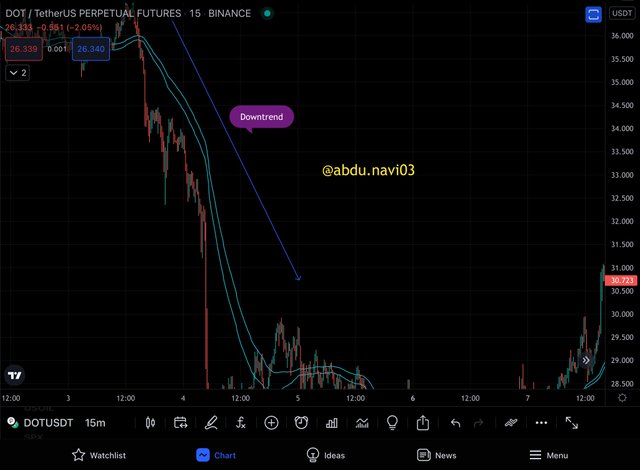
So you can see in the above chart of DOTUSDT that in the marked eclipse when the line of MACD intersect with the line of zero and then a red candle intersect and cross the two moving averages the downward trend started and someone who wants to do short trading for a low period of time spam can trade with the help of it
TIME FRAMES THAT CAN BE USED
As I stated and mentioned earlier that it's a strategy for intraday traders. It does work in a short period of time therefore the charts we can use or see can be range from 1m to 1H I. I 1 minute to 1 hour. I personally prefer a 30m or 15m chart. But keep that in mind seeing every chart is necessary from 1H to 5m and judge by it.
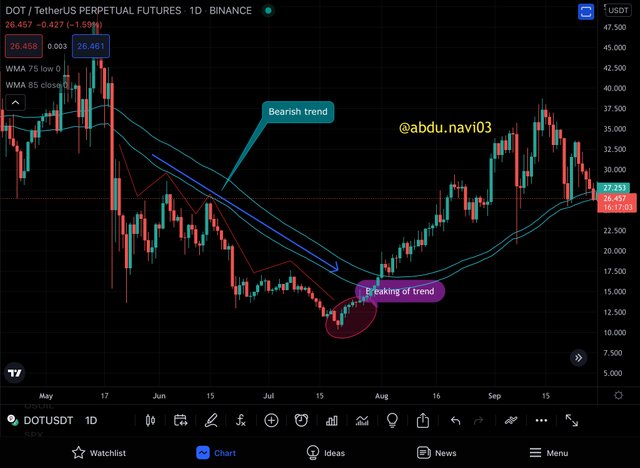
Yes, we can identify the trends with the Puria strategy. With the help of moving averages, we can easily see the current trend of the market. Such as if the price is being below the moving averages then its a bearish trend and if it's moving above the moving averages then its the bullish trend.
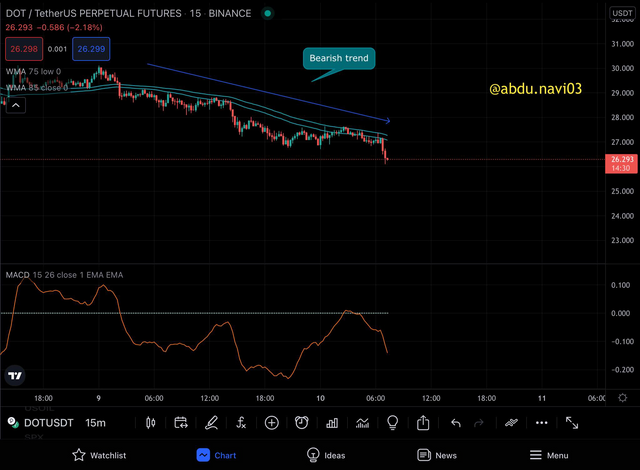
In the above screenshot from tradingview we can clearly see that with the help of moving average we can identify a bearish trend in the chart of DOTUSDT. Because price or candles didn’t intercept and cross the moving averages and stay below the moving average. It is still currently under the moving averages so it will not be a surprise if we see a big dump in its price
It is another example of a bearish trend
Similarly, an upward trend can also be identified if the moving average is below the price movement
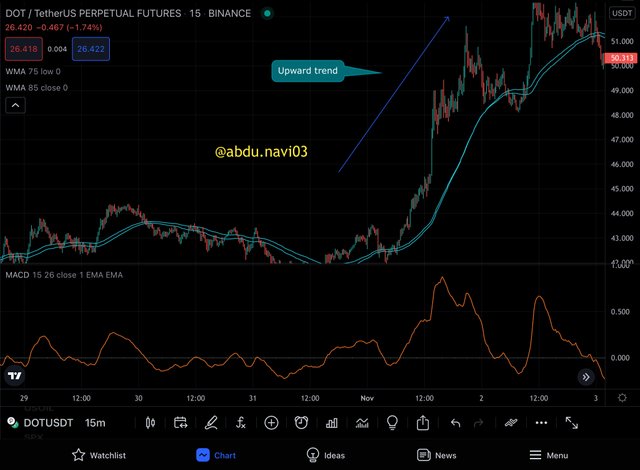
such as taking this above graph of DOTUSDT into consideration, we can clearly see as the price is remaining above the moving averages we can see an upward trend too
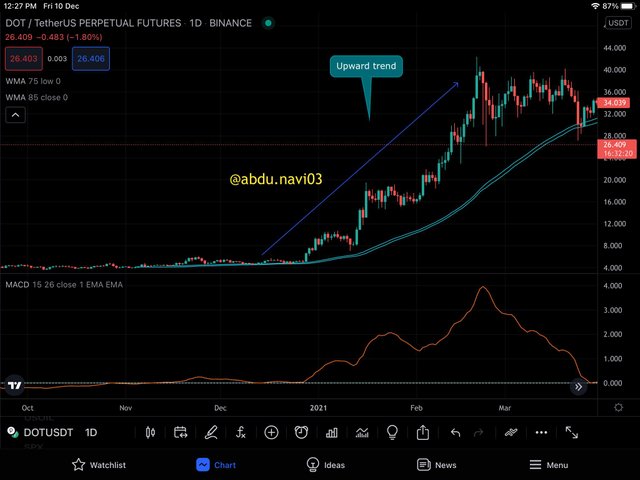
Also in this graph, it is more clear. As the price remains above the moving averages upward trend continues
- MORE FOR TREND IDENTIFICATIONS
We cant not just rely on this. So if we look focused in the graph we can see in bullish trend higher highs and lower highs are forming and in bearish trend lower lows and lower highs are forming
In the above screenshot ladder-type structure is formed for the prices indicating a bullish trend with a moving average
And in this screenshot, we can see a downtrend by not only moving averages but ladder formation which is in dating a bearish trend
YES we can identify a trend reversal with Puria indicative strategy as MACD we are using is based on convergence and divergence. When the price converges or diverts a trend reversal can be seen
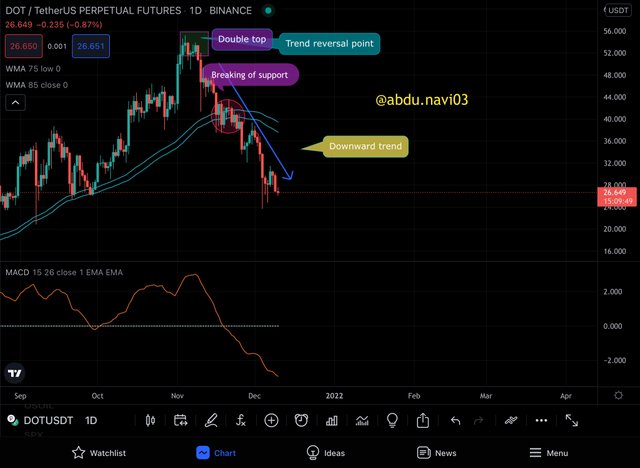
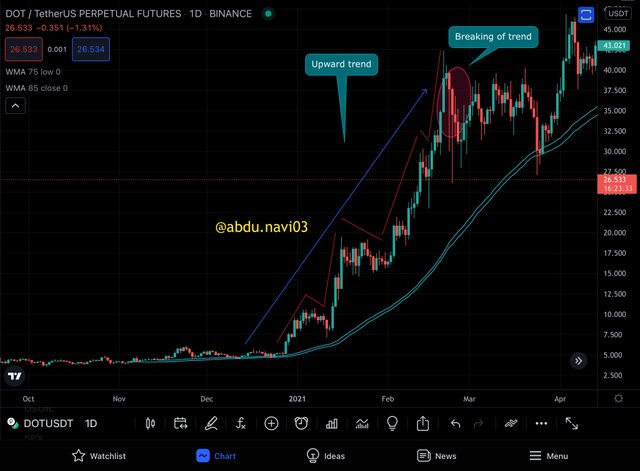
In the above screenshot, we can clearly see a trend reversal. As you can see a double top is formed and a double top formation is a sign of an upcoming downward trend. But with Puria indicative strategy we can also see it when. Price starts to come down, the moving averages or the zero line in MACD act as a support, when the got penetrated by the price movement it became obvious that a downward trend is started. So in this screenshot of DOT/USDT, we saw a downward trend movement with 2 strategies or methods. A trader can put a trade of short and earn profits by these strategies
In Puria strategy we can make changes and instead of using MACD, we can use CCI. So what’s CCI? It’s an indicator similar to MACD. It tells us about the price’s commodity. The commodity is somewhat similar to convergence and divergence therefore it's helpful to use it instead of MACD. Moreover, we can use it to double-check the buying or selling signal coming from the Puria strategy or any other strategy.
So the question is "HOW TO USE CCI?"
It’s very simple it also contains a zero line but above and below it 100 and -100 are present respectively. When the line crosses the zero line then it's a signal to be ready. If the line coming from the below and price movement penetrate the moving averages then a buyer can buy and when the line crosses 100 and the moving average is just below the price movement then it's a selling signal
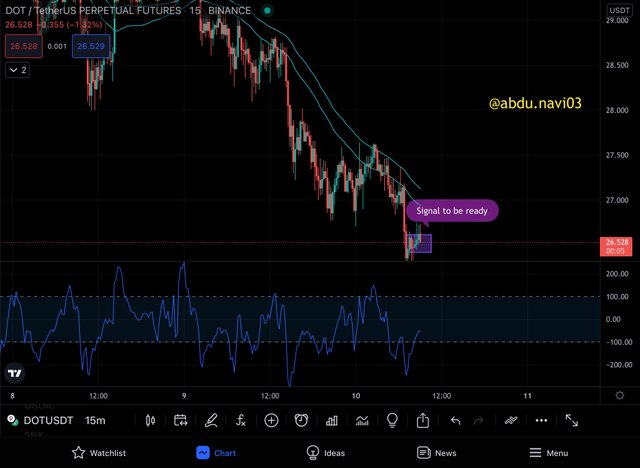
In the above screenshot, you can see CCI and MAs together. Right now the chart of DOTUSDT is telling buyers to be ready for the upcoming bull with the application of CCI and moving averages. When the price crosses the moving averages the chart will start to be bullish. And also 100 is somewhat resistant to this strategy. When this resistance will be broken we can see a. Bullish trend
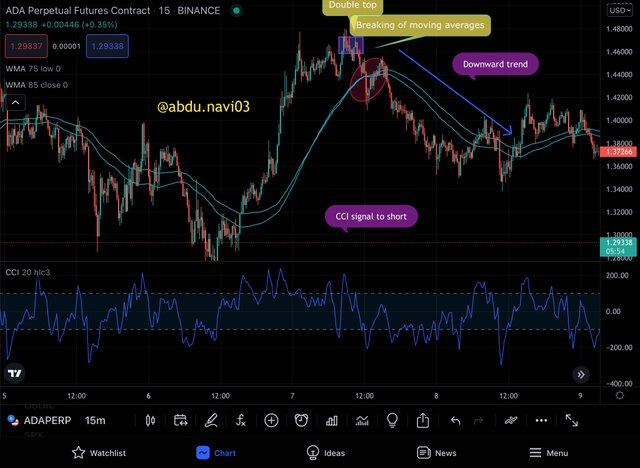
While in this screenshot a bearish trend is forming and it can similarly be identified by CCI like a bullish trend is identified. As in this ADA/USDT chart, I also mentioned the formation of the candle before a signal of bearish signal. However, with CCI or MACD or in short Puria strategy we can always play safe and keep our portfolio green.
I've put 10 trades 5 short and 5 long as the professor guided
LONG TRADES
SHORT TRADES
The explained two trades are;
- Long Trade
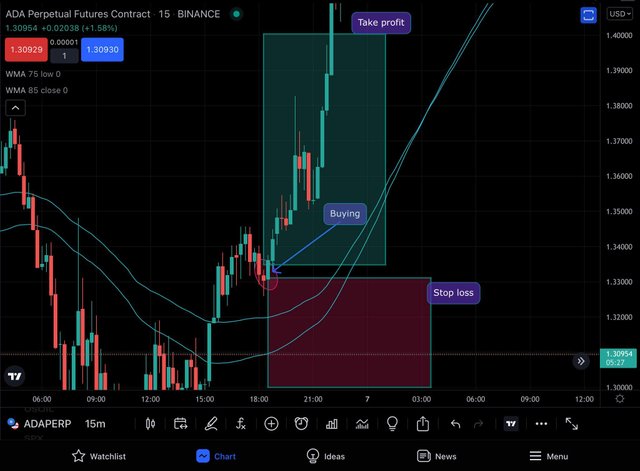
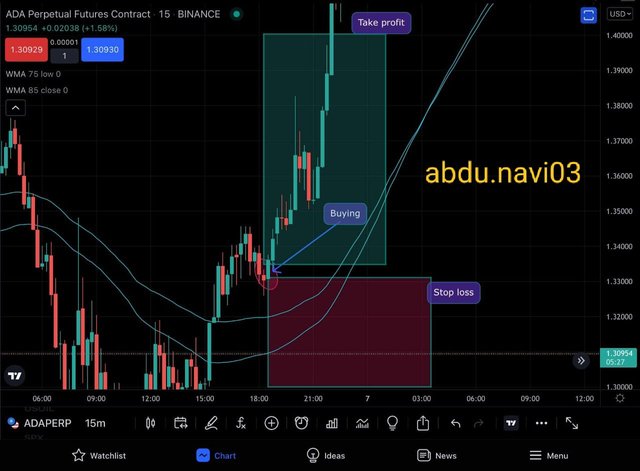
This long trade of ADA is really unbelievable because it was an unexpected profit. Though with Puria indicative strategy I could tell that there are many chances that it will go up. In the above ADAUSDT chart, we can see that the buying point is still up from the moving averages but its MACD was just above the zero line which gave me a signal of the bullish chart but I didn’t think it will go this way and I will have such an amazing profit. My buying price in the demo account of tradingview was 1.33 and I take out profit on 1.44 because that was the limit. Honestly, I wasn’t seeing the trade otherwise I’d call off the take-profit command and let it go to the moon. Anyways I still got a big profit. I used RSI and Stochastic with Puria strategy to help me identify upcoming bullish trend

I know the profit is just 3 dollars because the price I invested was very minimal. And it was my first demo trade out of 10
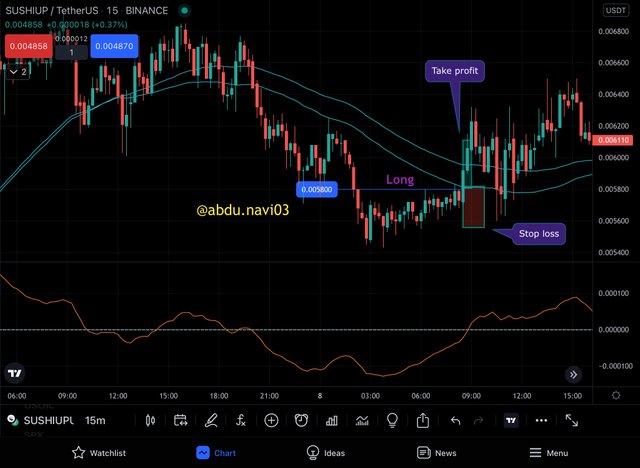
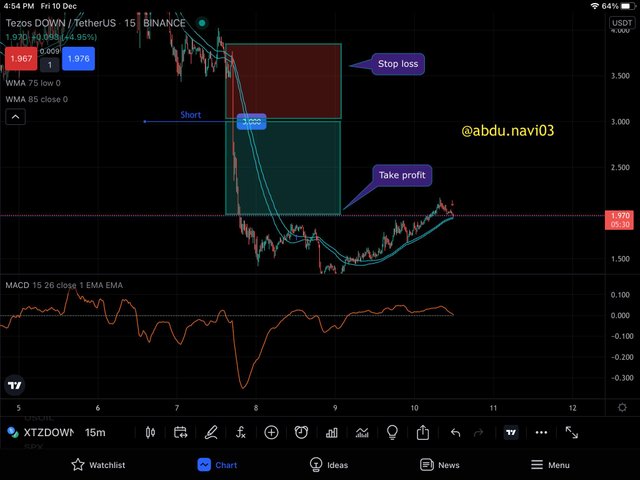
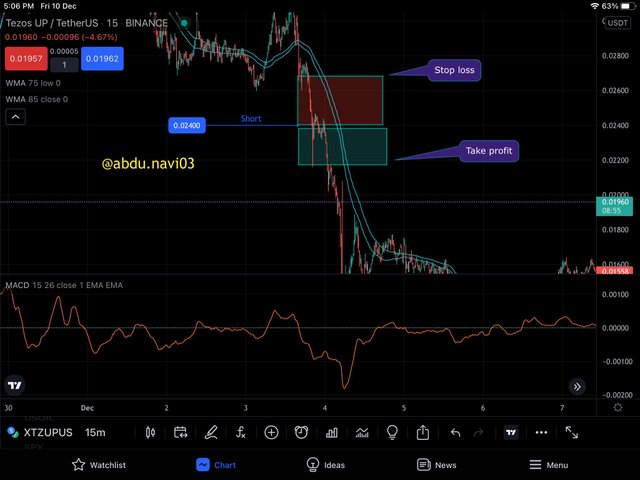
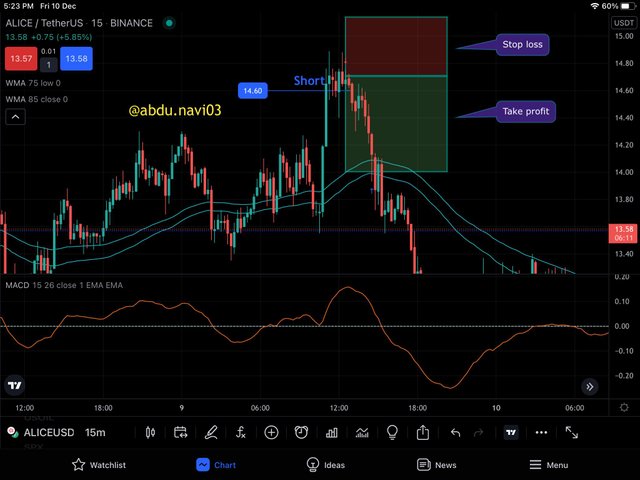
- Short Trade
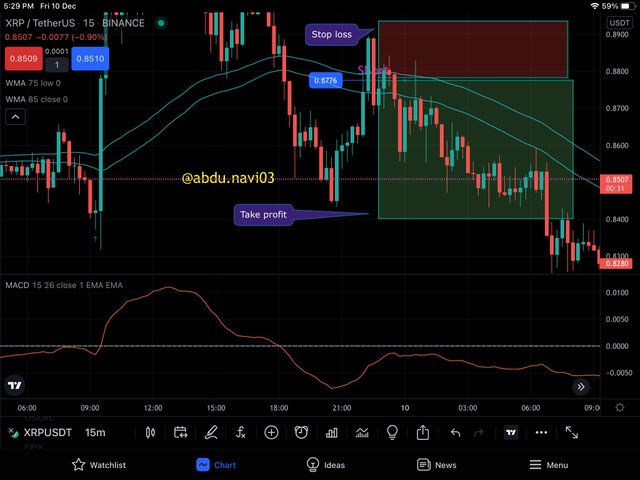
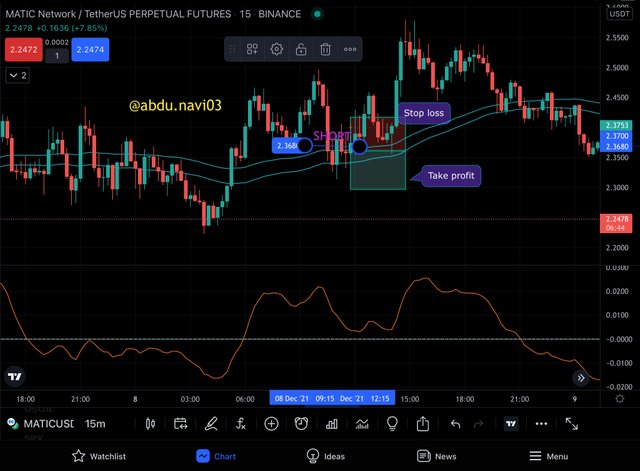
The above screenshot is the trade of short which I’m gonna explain in detail. When I open its chart I saw it coming down and quickly invested short trade by just using Puria indicative strategy and RSI and I didn’t check the stochastic because these coins are such fast in momentum and the price shifting volume is soo much that I couldn’t wait to check. As these coins are such vulnerable I call of the trade when I get the handsome amount of profit. Again if I didn’t apply the take profit call I could get more. But for that, you gotta be there and inspecting the chart every then and now. I’m happy I could make this even and I’m happier that Puria indicative strategy is making my portfolio green all the time.
THANK YOU PROFESSOR FOR IT.

As you can see I made a handsome amount of profit in this trade
| S/N | Pairs | Entry | Time frame | Profit | Loss |
|---|---|---|---|---|---|
| 1 | ADA/USDT | Buy | 15 minutes | $3.3 | -- |
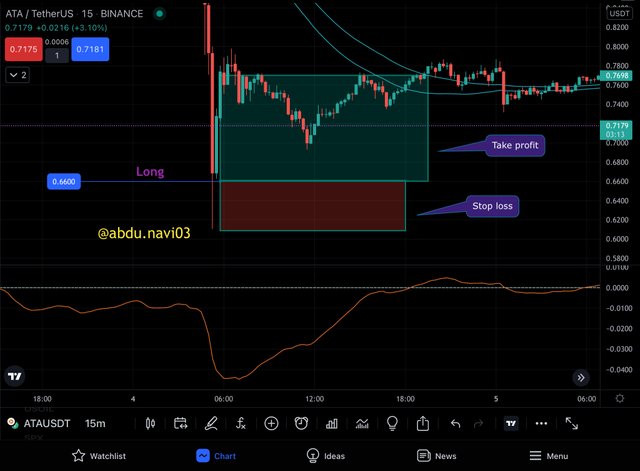
| 2 | ATA/USDT | Buy | 15 minutes | $157 | -- |
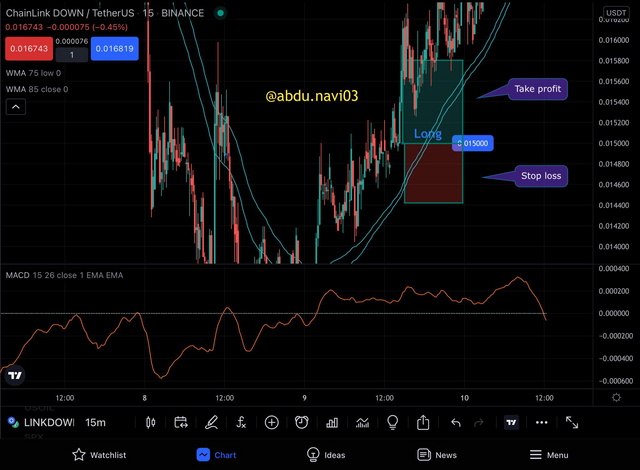
| 3 | LINK DOWN/USDT | Buy | 15 minutes | $778 | -- |
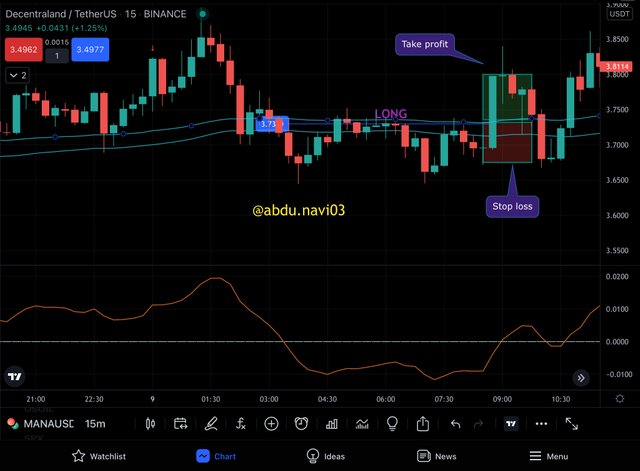
| 4 | MANA/USDT | Buy | 15 minutes | $65 | -- |
| 5 | SUSHIP/USDT | Buy | 15 minutes | $3.3 | -- |
| 6 | XTZDOWN/USDT | Sell | 15 minutes | $232 | -- |
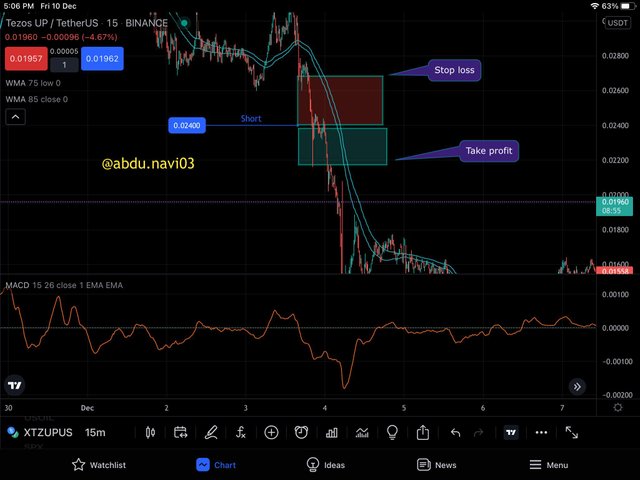
| 7 | XTZUP/USDT | Sell | 15 minutes | $142 | -- |
| 8 | ALICE/USDT | Sell | 15 minutes | $660 | -- |
| 9 | XRP/USDT | Sell | 15 minutes | $382 | -- |
| 10 | MATIC/USDT | Sell | 15 minutes | -- | $735 |
For preparing my strategy, I’m using professors' steps. I’m gonna name my strategy as multiple indicators strategy, as it is based upon using many indicators to not only get correct entry and exit but to tackle false signals. Though we can use trend formations in this strategy
So let's jump to the first step which is;
MARKET IDEOLOGY
As I stated it contain many indicators, therefore, it can be fully applicable on the stable market and less volatile markets not on nonvolatile markets. Because it contains many indicators. But the plus point is it can be applicable on not only intraday trades but on long trades too
Now the second step which is;
CHOSE THE MARKET
It can be applied on any market but as strategies are there for making your portfolio green therefore you all want your portfolio to be green as fast as it can be and for that crypto is more volatile than other markets and with better options so crypto is the best market for it
Now the third step is;
ENTRY AND EXIT
For entry and exit, we use EMA MACD RSI Stochastic and sometimes Donchian channels that I’d explain. So these many analytical indicators will make our trades best and give us the best signals. Therefore I think it can be used in volatile coins because we play total safe by applying this many indicators and be safe from false traps and signals
The fourth step is;
RISK MANAGEMENT
As we are playing with total safety you can proceed with 2:1 but 1:1 is better in any worst-case
Last but not the least
USING OF INDICATOR FOR FILTERING FALSE SIGNALS
I already explained how using a lot of indicators combined will make us free from false signals.
Now come to the settings of Strategy tools
- For BUYING
I’m using indicators with settings too in this explanation
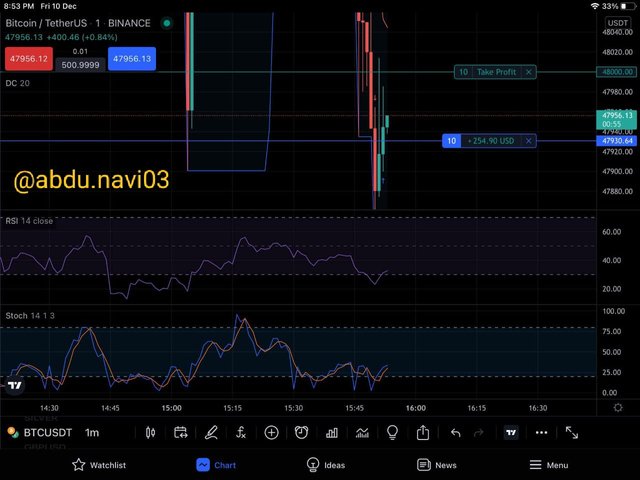
I first used Stochastic RSI and donchain channels
TIMEFRAME:
And for a short-term trade, I used a 1m chart.
DONCHAIN CHANNELS:
In this chart, we can see that donchain channels can tell us first that BTCUSDT jump from its support given from Donchian channels.
RSI:
RSI is just jumped from 20 which could be a bull signal but can turn into a bear because RSI usually go below 20 and jump from it
STOCHASTIC:
From Stochastic it is clearly a buy signal and therefore I started the trade before applying another half of my strategy which one shouldn’t do
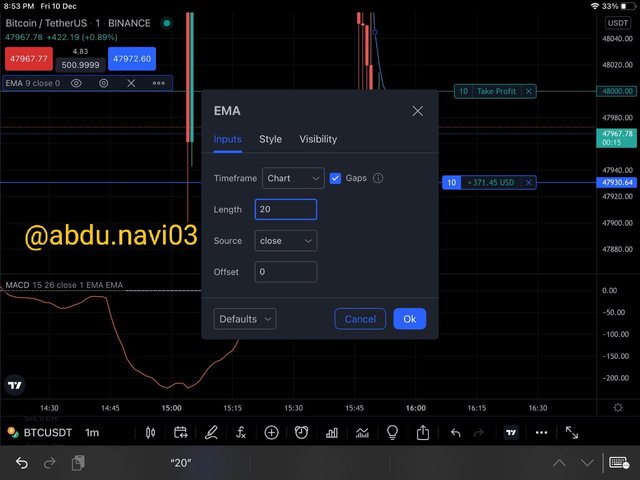
Then I use MACD that the professor set up because it is easier to read. And then apply EMA and for applying EMA using 20 Length is the best
As we apply these you can see that EMA isn’t visible why is that because EMA is very above in this chart, above than my take profit limit and that makes take profit thing more solid. But MACD is giving a signal of either a staying or downward trend. But as we can see the last curve of MACD was bearish then we can suspect this as a stabling zone and expect the other zone as a bullish zone. And other indicators are also indicating a bullish trend
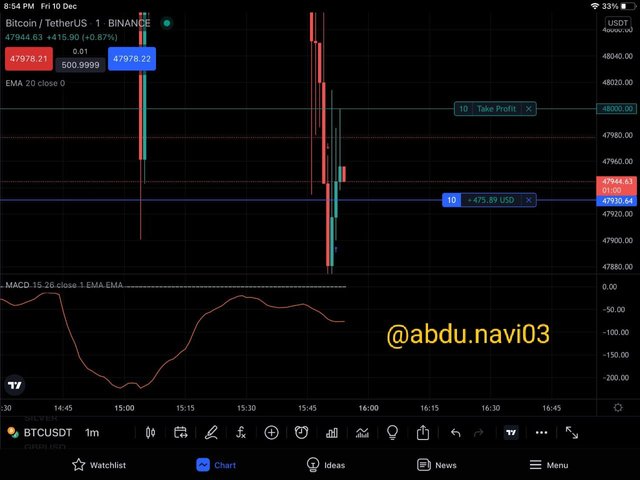
- FOR SELLING
I’m using indicators with the same settings
In this chart, we first checked MACD and EMA. EMA is giving a selling signal but not much because in no time this EMA line can join with price movement and turn into a bullish signal. Therefore in MACD, we can see the same situation here with ETHUSDT that was with BTCUSDT. But MACD is currently going down so we can assume it as potentially a selling signal
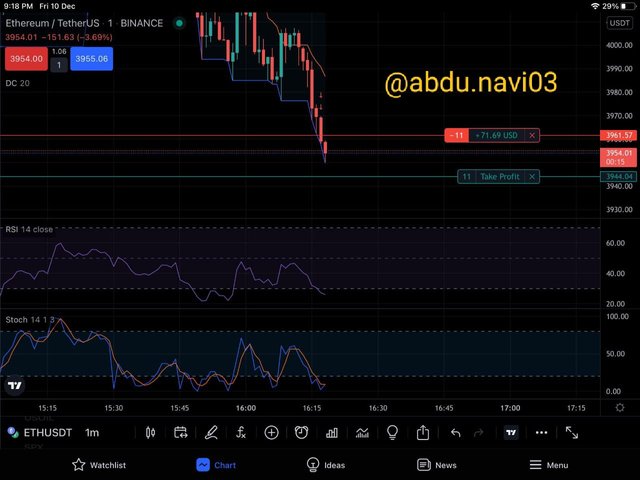
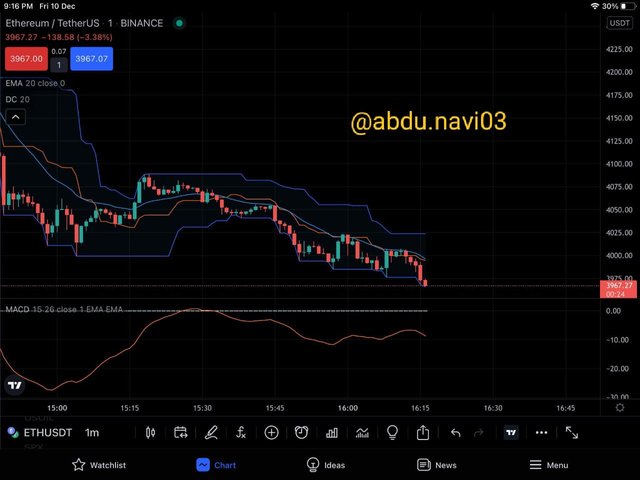
Now in this chart, you can observe Donchian Channels with RSI and Stochastic
DONCHAIN CHANNELS:
In this 1m, “a highly volatile” chart we can see donchain channels supports has been broken and I made a short entry
RSI:
RSI is giving a stabling signal for few minutes so we can’t trust it alone but it can go below 20 anytime
STOCHASTIC:
Stochastic is giving a signal of buying but we can see in its history that the last buying signal couldn’t make its way clear to 100 and gave a false signal. So therefore it can be a false signal of buying
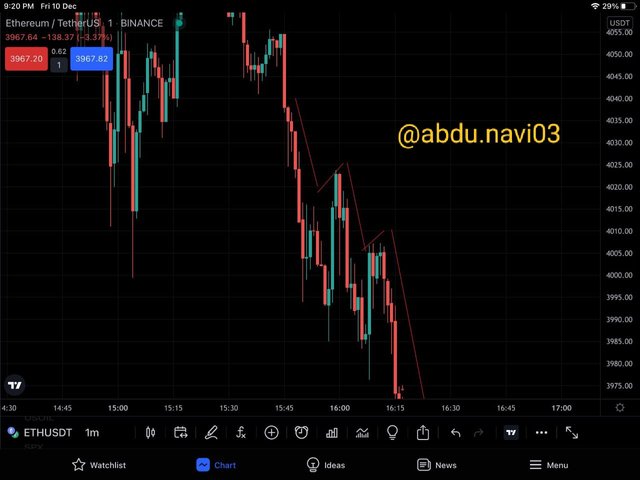
And here we can see ladder formation and can now stay with our trade
CONCLUSION
Strategies are very important for any trader and having your own strategy is always best because you made it and are familiar with it to use. And with demo trades you can actually see is it working or not correctly.
Learning Puria indicative strategy is very helpful and I also made a lot of profit from it in my demo account and demo trades. Will use it in a few days in trading. It is very helpful especially right now because there’s no Bull run and its very important to keep your portfolio green
Lastly thank you soo much Professor @utsavsaxena11 for this lesson. I hope I was able to meet all the objectives of this task as I put in all my efforts. So this is the end of my assignment. I hope you were able to grasp the basics of my lecture.
THANK YOU.
ps: All screenshots are taken from www.tradingview.com all the pictures have been sourced accordingly. The grammar was checked from grammarly.com while the markdowns have been done according to the Markdown Styling Guide.
Cc;
professor @utsavsaxena11
regards,
@abdu.navi03

Good explanation about "Puria Method Indicative Strategy".
Happy learning to follow Crypto Academy, I wish you more success.
Thank you brother.