"Bichi Indicative Strategy- Steemit Crypto Academy- S5W6-Homework post for @utsavsaxena11. " by @abdu.navi03
Hello everyone how are you all doing? I hope fine. I warmly welcome you to the fifth week of the 6th season. This is my first Intermediate course of this season.
In this lecture by Professor @utsavsaxena11 , we learned the basics of Bichi Indicative Strategy and also some details about IDX


For positive and good trades, traders use different strategies and indicators. Among them, one is Bichi Strategy that will keep you and your portfolio safe from any redness.
BICHI STRATEGY
INTRODUCTION
Bichi strategy is developed by our beloved professor Utsav. This strategy is composed of two major indicators. Both are very useful in their own ways, one i,e Bollinger bands use by traders frequently while the other one i.e Ichimoku clouds don’t use by newbie traders as much. So basically its name is composed of both the indicators, Bichi=Bollinger bands + Ichimoku clouds.
WORKING
This strategy works superbly, the main and important features of this strategy are listed below.
PROVIDING SUPPORT AND RESISTANCE:
In any trade, traders usually just after one thing in any strategy, and want that to be perfect, that is resistance and support. Why is that? Because if the price went down from support, they can open a short position and if the price went up they can open a Long position. In any case, they are in a green portfolio. So in Bichi strategy Bollinger bands provide support and resistance. I’ll explain that briefly when I will show the trades.
VOLATILITY:
Volatility is one of the most important factors traders look up to. Why? Because a volatile market can give you a sudden profit but also can give you a sudden loss, therefore traders always look up to know the volatility of the market they are going in. Some traders like volatile markets, they make good profit with great risk, while some like eased or less volatile markets, they make less profit but with less risk to lose all of their money. Therefore knowing the volatility is always great. In Bichi strategy Bollinger bands do this for us.
PRICE PREDICTIONS:
For price predictions, as it is also one of the most important aspects for traders, Bichi strategy has Ichimoku Clouds. The question is how it will predict? Ichimoku clouds consist of a lagging green line and future clouds. A combination of both tries to predict the price that will be in near future by keeping a record of trends. Noted that they can also be wrong.

TREND IDENTIFICATION WITH THE HELP OF BICHI STRATEGY
Bichi strategy can be very useful in identifying the trend. Here are a few examples;
AN UPTREND
For the uptrend breakout, there are two points that the trader using Bichi strategy should keep in mind. These two points are regarding the investing of one’s money.
1–BUY SIGNAL FROM BOLLINGER BAND
When, downward trend, price intersects and later cross the baseline of Bollinger bands it will act as a breakout signal. Not only that but the baseline will also act as the support for the price moving upward.
2-BUY SIGNAL BY ICHIMOKU CLOUD
When the price has broken the baseline of the Bollinger band, that is, the signal of buying from the Bollinger band, and later when it will break the Ichimoku clouds, there will be a confirmation to the buying signal given by Bollinger bands
After all that the baseline throughout the bullish run will act as a support to the price
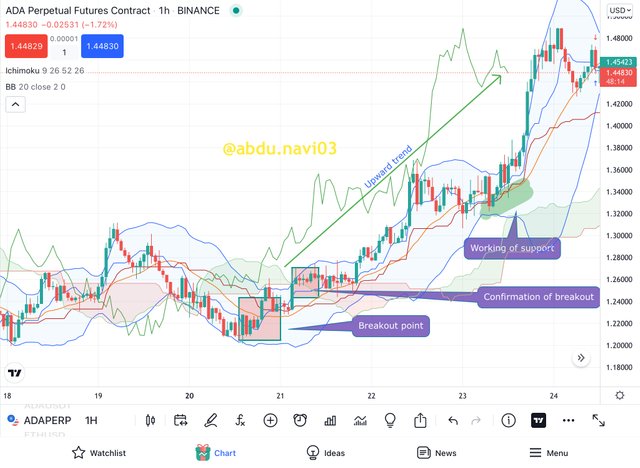
In this screenshot of ADA/USDT futures on Binance, having a timeframe of 1H we can see that the Bollinger bands first gave a buy signal when a breakout happens. So now as per the strategy, the baseline (orange line) will become the support of this bullish trend. So should we invest our precious dollars? NO. Because there’s another signal to come. The other signal is when the clouds of Ichimoku break by the price. That happens and I marked it, it is our confirmation. We can now invest our money according to this strategy. And in the journey of price, we can see how the baseline is acting as a support.
A DOWNTREND
For the identification of the downtrend, there are also two points that the trader using Bichi strategy has to keep in mind. These two points are regarding their investment.
1-SELL SIGNAL FROM BOLLINGER BAND
When upward trend prices intersect and later cross the baseline of Bollinger bands it will act as a breakout signal. Not only that but the baseline will act as a resistance for the price moving downward.
2-SELL SIGNAL BY ICHIMOKU CLOUD
When a price has broken the baseline of Bollinger bands, that is, the selling signal from Bollinger bands, and later when it will break the Ichimoku clouds, there will be a confirmation to the selling signal given by Bollinger bands.
After all that the baseline will act as the resistance throughout the bearish trend or run.
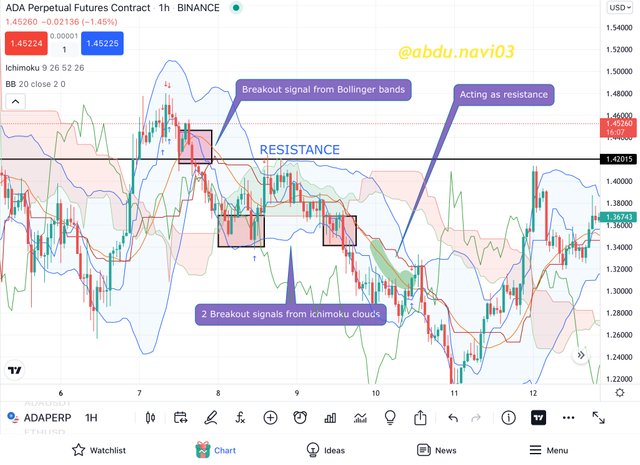
In this above screenshot of chart of ADA/USDT of futures in Binance, of time frame 1H, we can see that there was also a short signal from as explained. As the baseline of the Bollinger band is intercepted by the price coming down from the bullish trend we get the first signal from the strategy. But traders using Bichi strategy aren’t allowed to invest their precious money now. When the cloud of Ichimoku has been infiltrated by the price as marked. There’s the price movement. As you can see that after that signal we saw some green candles. And red candles also make double low, which is a buying signal. Then as mentioned, in the screenshot the top of Ichimoku clouds and Bollinger bands worked as resistance for it. As our stop loss must be at that price, to manage our portfolio. As the price couldn’t break the resistance, it went down now we can expect a huge profit. If any trader who didn’t invest at the first confirmation by the Ichimoku clouds as there was no 2nd red candle after breaking of Bollinger bands, he can invest now on the second breaking of Ichimoku clouds. After that, we can see that the baseline of Bollinger bands is working as resistance.
IDENTIFYING TREND REVERSAL BY BICHI STRATEGY
Identifying trend reversal is more possible than probable by using this strategy as Ichimoku clouds are the predictors of trend in this strategy.
UPWARD TREND REVERSAL
It is a trend reversal that happens after a bearish trend ends and suddenly changes into a bullish trend. We can identify it by using Bichi Strategy. Bichi strategy contains the Ichimoku clouds which will tell us about the stableness of the price, meanwhile, Bollinger bands will help us in determining the volatility which will tell us about whether it's a trend reversal to upward or just a mere correction.
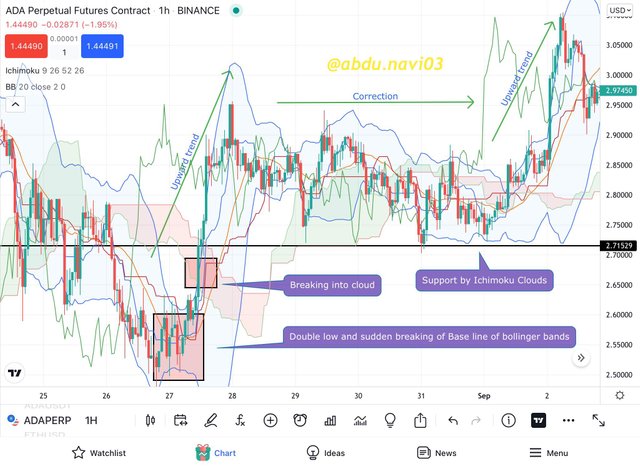
In the above screenshot of ADA/USDT of futures of Binance, the time frame of 1H we can see that how with the help of Bichi strategy we see the trend reversal. First of all, we can see that there was the technical formation of candles occurs which already tell us about an upcoming bullish trend, that is double low. Then with the help of Bollinger bands of Bichi strategy, we can see that we get a buying signal. But it's not a normal buying signal because after having a bearish trend, the Bollinger band quickly gave a buying signal. That means, first it's not false ( which we will filter by Ichimoku clouds), and second that it's trend reversal signal because the average of lower lows and higher highs is being too low, and the price couldn’t form expected lower low. As it also tells us about the volatility, we can see the space between lower lows and upper high price lines formed by the Bollinger bands. If the space is more, volatility is high. After that, we can see that Ichimoku confirms the signal and now we can take entry. As we can see in the correction phase afterward, Bollinger bands advised exit from the market but as the support given from Ichimoku hasn’t been broken, the price continues to grow upwards. This results in another sudden bullish trend and only Bichi strategy use can take maximum profit, not Bollinger or Ichimoku users (those who are using them separately)
DOWNWARD TREND REVERSAL
It is a trend reversal that happens after a bullish trend ends and suddenly changes into a bearish trend. We can identify it by using Bichi Strategy. Bichi strategy contain the Ichimoku clouds which will tell us about the stableness of the price, meanwhile, Bollinger bands will help us identify the volatility, which will tell us about whether it is a trend reversal to downward or it is just a mere correction
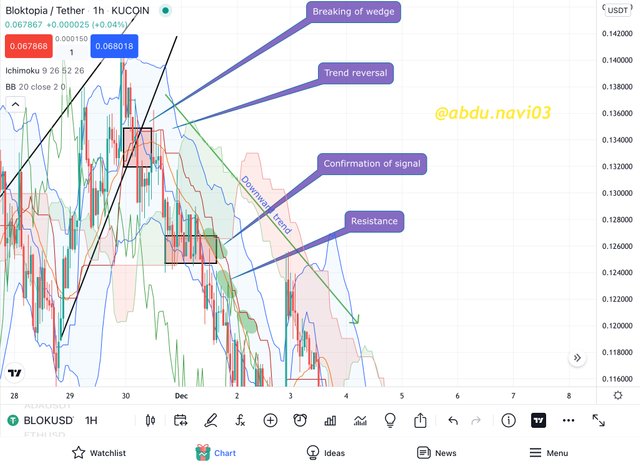
In the above chart of BLOK/USDT of KuCoin of 1H, we can see the trend reversal, denoted by Bollinger bands. By the same method, as after bullish trend directly turn into the bearish trend without going into correction and in few candles baseline have been intersecting, which means the green candle or bullish candle should be formed by more high.
Also, we can also see that a wedge pattern is also been formed, which resistance hasn’t been broken by the green candle. Meanwhile, the support has been broken by them which means that an upcoming bearish trend.
Confirmation by Ichimoku clouds, after that we can see a big profit. However if someone tries to invest at the Bollinger signal and wedge signal, he can earn more profit, but it is not advised if you can’t check your trade continuously because it can be a correction too and then a few bullish candles can disturb your portfolio if you took any leverages.
ENTRY AND EXIT FROM THE MARKET
We can take the entry from this strategy with the help of the Bollinger band and Ichimoku clouds. When the price breaks the baseline of the Bollinger band and continues in the same pattern, the baseline will be the support of the Bollinger band. The exact and safe entry point would be the point when Ichimoku cloud breaks by the price. And for the exit point, the same strategy can be applied, when Bollinger bands baseline breaks by the red candles or by the price after the bullish run. Because the baseline is working as support/resistance from where we can identify our exit point.
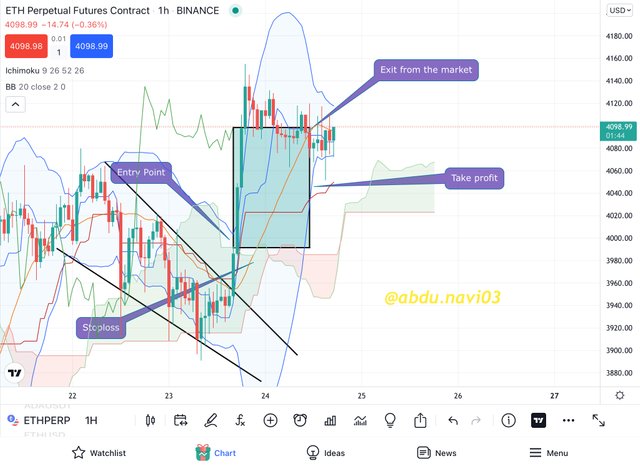
In the above chart of ETH/USDT, we can see the entry and exit signals from the Bichi Strategy. This strategy gave a signal when the price crosses the baseline of Bollinger bands and Bollinger bands start acting like support for the price, then the confirmation of signal happened when price crosses the Ichimoku clouds. After that, the exit signal can be seen when the Bollinger bands baseline has been broken by the price. In this way, the trader can trade loss-free trading and keep their portfolio green
DEMO TRADE
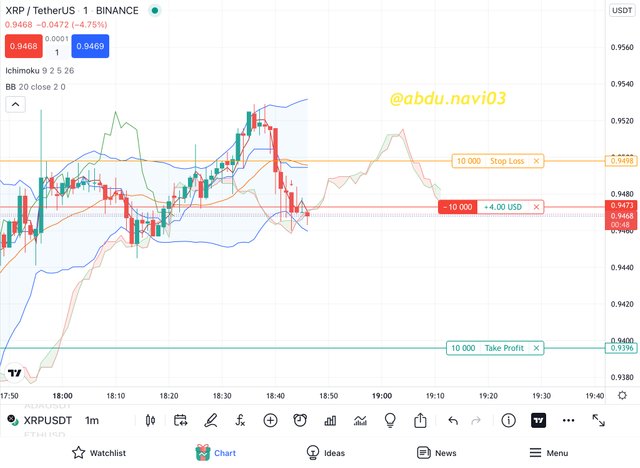
This is the demo trade I put. As you can see I put a paper trade after I saw the insertion not only through the baseline but through the Ichimoku clouds. My take profit is a bit higher which will be adjustable depending on chart performance. But as you can see my stop loss is on the baseline of Bollinger bands, because the baseline of Bollinger bands is acting as a resistance
This chart of XRP/USDT is my Demo chart.
The risk ratio here is 1:1
OPINIONS ON BICHI STRATEGY
1-INTRA DAY:
This strategy is one of the best strategies for intraday trading and quick profits
2-SHORT TIMEFRAMES:
The time frame for this strategy is less than 1H, more than that is not recommended because it is intraday, trades must use less than 1H
3– EASY TO LEARN:
This strategy is way easier to learn, and half of the strategy is based upon Bollinger bands. And Bollinger bands are a very popular indicator among traders so it is very easy to learn strategy
4-FOR NEWBIES:
As it is so easy to learn, those newbie traders who face hurdles in learning different indicators and technical analysis can learn this and be confident with their short trades
5-ACCURACY RATE:
From 10 out of 8 or 9 trades are right which means it's filtering out false signals too by giving the right signals. Its accuracy rate is all that most traders need, a green portfolio
CRYPTO IDX
Crypto IDX basically is average. An average of the four most famous coins of cryptocurrencies, which are Bitcoin, Etherium, ZCash, and Litecoin. The average of all these can not be obtained easily. For obtaining their average complex software, feed by some complex mathematical problems works. And what one obtains by the average of these four? The answer is simple, all four go bullish or bearish somewhat similarly. So what? Platforms like Binomo.com allow users to predict the price of average and earn money if they predict right. But they will lose money if they predict wrong. Is it like trading? NO. In trading users buy an asset to sell it in the future, here it's just the prediction. This means only skill full traders can participate in it and earn a fortune. Around 900K users daily use it and it can operate in more than +133 countries.
For doing Crypto IDX trading we first have to create an account in it then go into the website
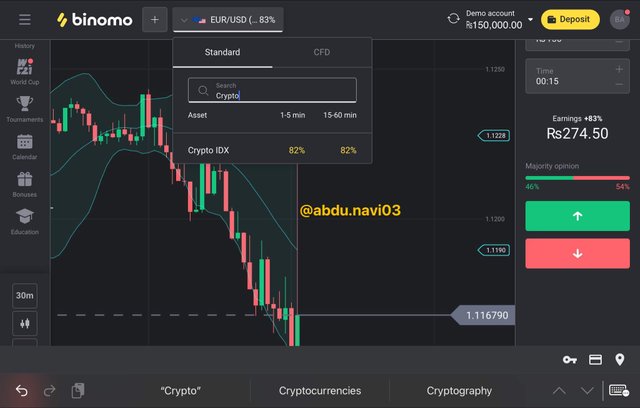
After searching crypto IDX you will get this window;
Here you can see the current price of these averages, and I will show you how you can predict it with just one touch.
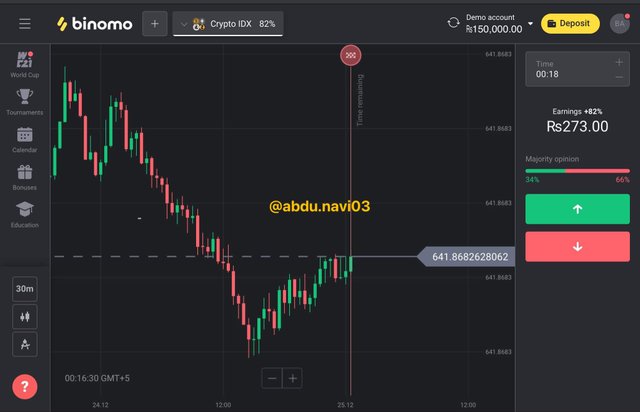
Now I’d say the price will go up, so all I’d do will be that I’d just touch the green arrow
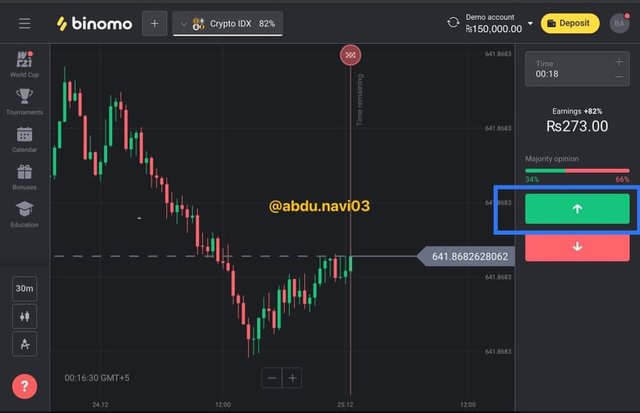
As when I push, this happens
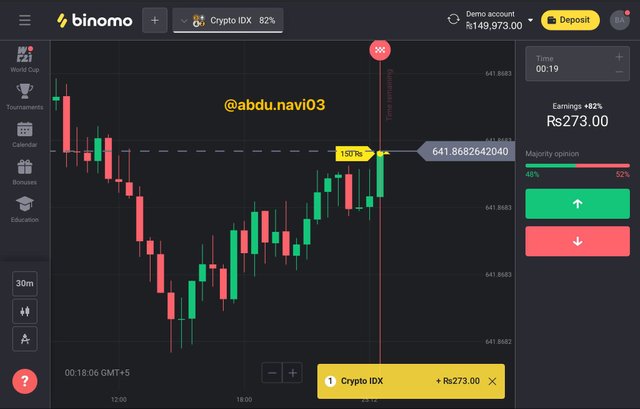
Luckily I won on my first prediction. I put a predictionary bet of Rs.150 that the average will go up, and it did and I won Rs 273.
ALT IDX
Similar to Crypto IDX there is Alt IDX in this platform, consisting of an average of four altcoins, which are Etherium, Ripple, Litecoin, and Montrose. These averages are not simple averages, they are calculated and computed by complex software, containing the ability to solve complex and difficult mathematics problems.
Similarly, you can not buy it like an asset, you can predict its future and earn from it.
Let me show it too
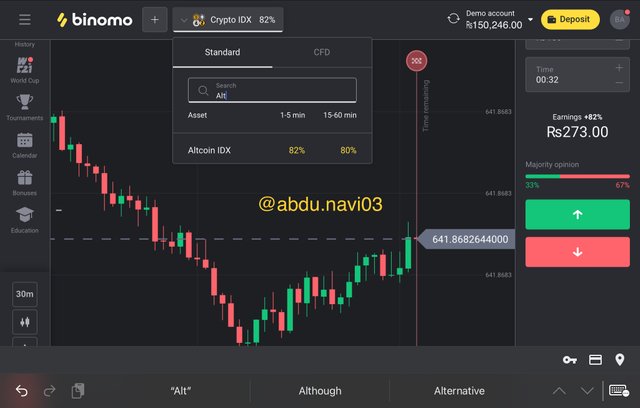
By searching Altcoin IDX we can go to its window
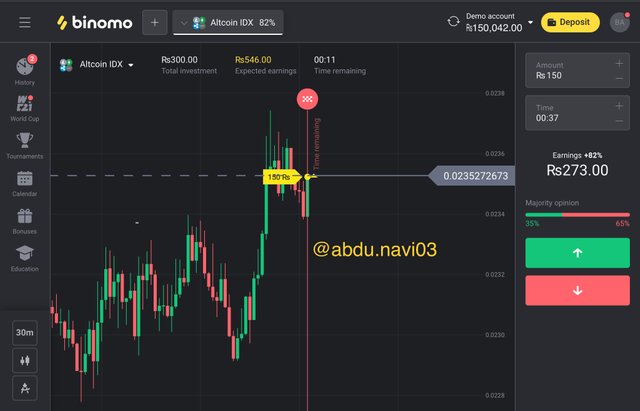
In this screenshot, you can see that I predicted through my demo account and winning the prediction, you can see expected earning and my earning both
LEGAL OR ILLEGAL?
It is not illegal in my country Pakistan, as one can easily reach out to the website, create an account on it and withdraw and deposit money on it. There’s no legislation right now, which means it's not illegal. But it's not very popular among Pakistani traders, as you know Pakistan is the third-largest country in holding crypto assets.
Recently Binomo earn a few awards too, which make its reputation good. It is formed in India in 2018 and since then worldwide traders are amazed by it and investing in it
PENNY CURRECNCIES
Penny currencies are the term used for cryptocurrencies that are less than that of one dollar. Because penny is less than one dollar
MY CHOICE OF PENNY IDX
My choice for my Penny IDX will be these four coins from the Polka DOT environment,
1-ZRX
2-REN
3-ONT
4-OCEAN
Because they all belong to one ecosystem or environment, which means they’ll see pump or dump together. That makes them more profitable for traders, but it will be fun too because the averages of them can be really fun in the sideways market, as one or maybe two of the pump and two of them start to dump, in any scenario, traders would lose money, so in the bullish market its everyone’s profit, but in the sideways market only real trader can play. Basically rather than trading it's just risk, predicting the price which will go up and not.
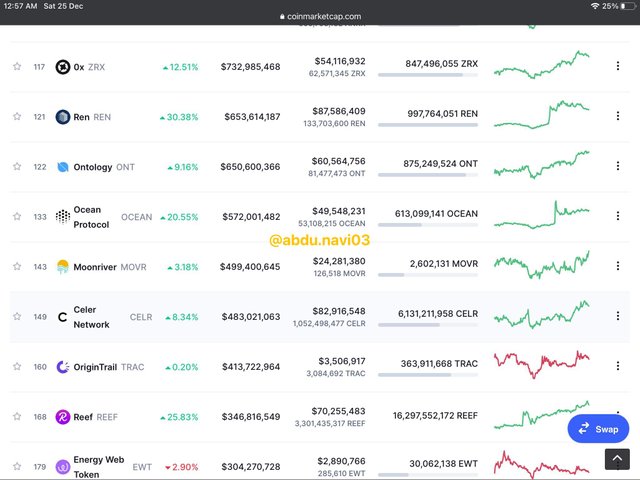
This screenshot is the visual example of that as they are of the same ecosystem, all of them having the bull run together but one thing is to be noted that there is one complete bullish phase in two and successive bullish phase in two, making them balance when it comes to the risk of an IDX
CONCLUSION
Crypto Market is a highly volatile market compared to other makers. Moreover, it involves your money directly not by any product. You can buy and sell assets. For trading in such a volatile market, traders must be smart and sharp enough. To make profit traders use different strategies and indicators. Among them, everyone has their own way to predict the features of the chart or prices of the chart. It is always advised to use two or more indicators before investing in such a volatile market. Therefore strategies like the Bichi strategy are always helpful. It contains 2 indicators that can superbly predict the right time entry and exit from the market. As the crypto market is volatile, traders can also earn from intraday trading. For intraday trading, strategies like the Bichi strategy are best and always recommended.
IDX is the new growing way. A platform like Binomo really revolutionizes bets and investments. It started in India but now has been popular with many skillful traders. It. Allows you to predict and bet on your prediction of the average price to earning from the platform. These kinds of revolutionary projects are real treats to blockchain technology.
I hope I was able to meet all the objectives of this task as I put in all my efforts. So this is the end of my assignment. I hope you were able to grasp the basics of my lecture.
THANK YOU.
ps: All the pictures have been sourced accordingly. The grammar was checked from grammarly.com while the markdowns have been done according to the Markdown Styling Guide.
Cc;
professor @utsavsaxena11
regards,
@abdu.navi03
