[ Advanced Technical Analysis Using Fractals ]-Steemit Crypto Academy | S5W8 | Homework Post for @reddileep by @abdu.navi03
Hello everyone how are you all doing? I hope fine. I warmly welcome you to the 8th week of the 5th season. As I have newly turned to reputation level 65, this is my first advanced assignment in this community. I hope you'll enjoy reading it. So let's begin
In this lecture by Professor @reddileep , we learned the basics of Technical analysis using fractals


Cryptocurrency is subject to market, traders in it trade with investing their money and either have profit or bear loss. For this, the traders use various strategies to be in profit and dodge losses to keep their portfolios green. For this purpose the traders use, either intraday or long trader or even whales (traders with high capital), different indicators and strategies. But the main question is Why do they use indicators? And How indicators indicate the almost correct value? Because the crypto market just like any other market, show repetitive patterns in its price, these patterns are not 100% alike, but they are alike enough to indicate the color of the upcoming candle, it can tell a trader easily that the upcoming candle would be green (bullish) or red (bearish).
FRACTALS
This assignment is related to it. This assignment is about fractals. Fractals are the repetitive patterns or candles shown by the price. The repetitive patterns help us to identify the upcoming trend as that trend occurred already in the past. So question is, the upcoming trend would 100% alike? The answer is NO, not in most cases, it can be, but there’s no certainty about that. The simple equation is, the more the fractals are alike the more the trend will be alike.
PARAMETERS OF FRACTALS
Apart from candles and price, fractals basically based on trends. Because it’s identifying an upcoming trend, therefore it must be obvious that an upcoming trend is indicated by a trend. And for trends in fractals, there must be at least 5 candles, less than 5 candles can be right too but can be wrong too. With 5 candles the accuracy of the strategy or trend can be strong and a smart trader happily sacrifices a small portion of profit rather than risking all of his money.
INDICATORS
There are various indicators based on fractals, but the most famous one is Williams Fractal used by traders mostly. It basically depends on the formation of higher highs and lower lows. If any of these forms the indicator will not give any signal. But if any of these doesn’t form, in other words, if the price fails to form the higher high or lower low, the indicator will give a signal.
Fractals are used to indicate bullish and bearish charts both. But we must remember one thing while using this strategy is that, we wait for at least 5 candles to enhance the accuracy of our indicator.
BULLISH
Bullish formation of the price chart can be indicated by fractals when price fails to form a lower low, which means the candle just after the lower low has a higher low compare to the last candle. Let me elaborate this pictorially.

In the above picture, you can clearly see that the price fails to make a new lower low, as it fails to make a new lower low, the candle turns to green, this green candle is the signal of buying and the indication for an upcoming bullish trend.
REAL CHART EXAMPLE
I'm going to use the tradingview to take screenshots from it and show you that how the real pries of crypto assets behave. The upcoming screenshot will surely strengthen my this claim about the bullish trend.
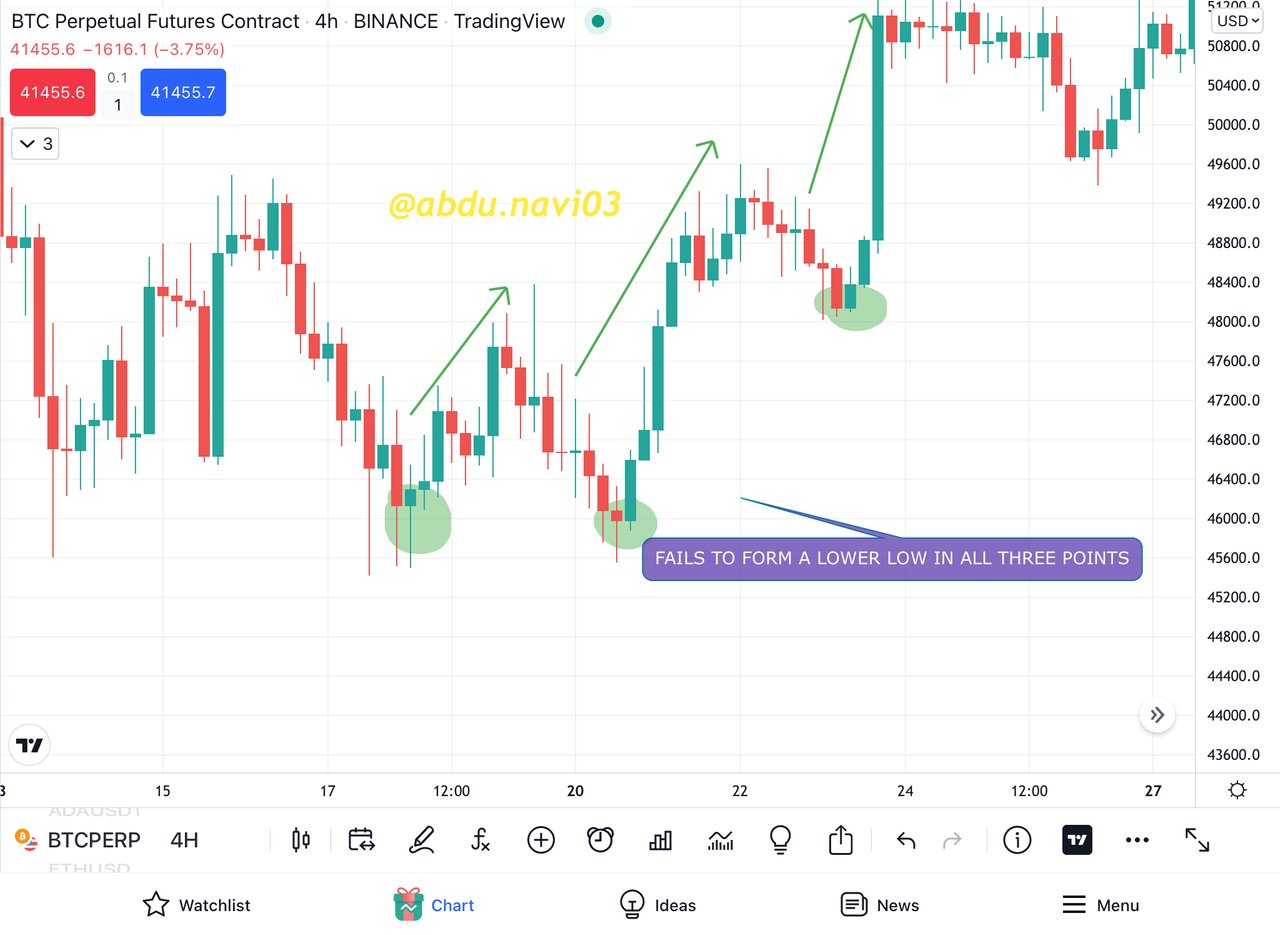
In this screenshot of the price of the chart from tradingview application of BTC/USDT Futures from Binance, having timeframe of 4H, we can see that in a single screenshot the price fails to form lower low three times and all three times the chart turned into a bullish pattern. A trader, especially an intraday trader can be very beneficial if he trades through these techniques.
BEARISH
Bearish formation of the price chart can be indicated by fractals when price fails to form higher high, that means the candle just after the higher high has a lower high compare to the last candle. Let me elaborate this pictorially

In this above picture, you can clearly see that the price fails to make a new higher high, as it fails to make a new higher high, the candle turn red, this red candle is the signal of selling or shorting the position and the indication for an upcoming bearish trend
REAL CHART EXAMPLE
I'm going to use the tradingview to take the screenshot from it and show you that how the prices of crypto assets behave. The upcoming screenshot will surely strengthen this claim of a bearish trend.

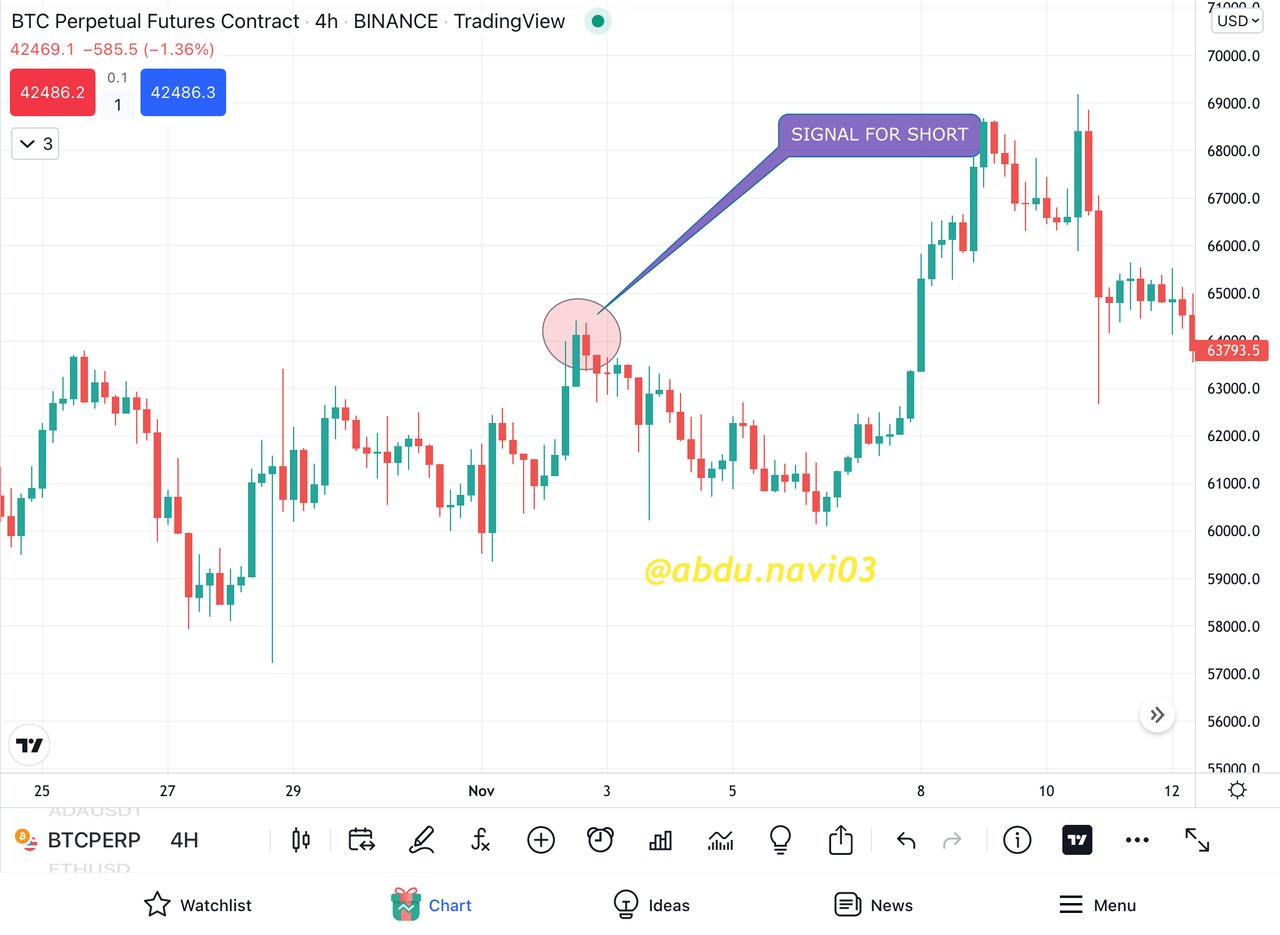
In this screenshot of the price chart from tradingview application of BTC/USDT Futures from Binance, having a time frame of 4H, we can see that the price fails to form a higher high and after that, the chart turns into bearish and the price fall down. A trader, especially an intraday trader can be very beneficial if he trades through these techniques
As I explained earlier fractals are one of the most loveable ways for traders to make entry into the market. Therefore there are many indicators of different kinds based upon fractals. They all work differently but their basic idea of working is fractals.
For applying any indicator you must go to any platform which will show you the price with indicators. For this purpose, I will use tradingview application. As you will enter it you must click/touch where fx is written.
And search fractals in it.

As you can see in this screenshot when I searched fractals many indicators lists have come in front. Now one must be thinking about which indicator should a trader use. Therefore you can try anyone, and it is recommended to try first in demo trades before using any indicator and if you feel comfortable with everything of an indicator only then use it. So that is why you can use any of them after mastering them in demo trades.
WHAT I USE
I am going to show what I use for trading using fractals.
1-WILLIAM FRACTAL INDICATOR
As the respected professor also explained in his post that most of the fractal indicators users use William fractal indicator. For applying it you should search William fractal in this search bar. And then apply it.

The William fractal indicator works in a simple way. Whenever a higher high or lower low fails to form it gives a signal.
HIGHER HIGH
Whenever a higher high fails to form a green arrow appears upward the candle. This green arrow above the candle is an indication of a downward trend or a bearish trend. This bearish trend can be profitable and a smart trader who is using William fractals indicator should use this to be in profit.
LOWER LOW
Whenever a lower low fails to form a red arrow appears below the candle. This red arrow below the candle is an indication of an upward trend or a bullish trend. This bullish trend can be profitable and a smart trader who is using William fractals indicator should use this to be in profit.

In this screenshot both the signals according to the above description are mentioned. Hope this picture will clarify it if the description doesn’t.
2-FRACTAL SUPPORT RESISTANCE (by synapticEx)
Any trader in any country cares about two things the most. The support and the resistance. If the support gets broken by the price then the chart will be bearish and if the resistance is broken by the price then the chart will be bullish. But identifying these through fractals is a tremendous way to keep your portfolio green.

This indicator gives the signal of buying or selling whenever the higher high or lower low fails to form. But works differently.
It works not that simple. Whenever the price fails to form a higher high or lower low, two-line appear, one is green, starting from the head of the last highest high and one is red starting from the bottom of the lowest low. These two lines act as resistance and support easily. It means the price will range between them. Or in case any of them get broken, the price will go in its direction that’s where the signal comes for us.
BULLISH SIGNAL
Whenever a lower low fails to form, a support line appeared but the resistance line must already be present there, so according to this trader a trader must open a long position when the resistance line gets breaks. And exit the position on three things, either of them happening is a signal of exiting from the market.
1-Forming a new resistance line. It indicates that the new higher high fails to form
2-Breaking of new support
3-Breaking of resistance in which trader bought the asset
BEARISH SIGNAL
Whenever a higher high fails to form, a resistance line appeared but the support line must already be present there, so according to this indicator a trader must open a short position when the resistance line gets broken. And the exit the position on three things, either of them happening is a signal of exiting from the market.
1-Forming a new support line. It indicates that the new lower low fails to form
2-Breaking of new resistance
3-Breaking of support in which traders open a short entry.

In this screenshot both the signals according to the above description is mentioned. Hope this screenshot will clarify if any queries you have with the above description.
Fractals not only can be identified by indicators but can also be seen in price chart graphs. These fractals can be identified in two ways. Both the ways will be elaborated later on
BULLISH TREND
FIRST WAY
For first, if the price fails to make a lower low then it is the signal of a bullish trend. This is the signal for which a trader should wait patiently and act accordingly.

In this screenshot of BTC/USDT you can see when the price fails to form a lower low, the chart turns bullish.
SECOND WAY
the second way is, as I explained in this assignment that crypto asset prices repeat their trend, repeat the formation of the chart, therefore a trader can use it to identify the upcoming trend. Please allow me to elaborate it further, pictorially.


In the above screenshots of charts, you can see that the pattern in the chart is repeated and so is the trend that comes after the pattern formation. But both the groups of candles are not alike and nor the volume of bullish trend they had but the direction of the trend was the same
Both are almost 70% alike
BEARISH TREND
FIRST WAY
For first, if the price fails to make a higher high then it is the signal of a bearish trend. This is the signal for which a trader should wait patiently and act accordingly
In this screenshot of BTC/USDT you can see when the prices fail to form higher high, the chart turn to bearish
SECOND WAY
The second way is, as I explained in this assignment that crypto asset prices repeat their trend, repeated the formation of the chart, therefore a trader can use it to identify the upcoming trend please allow me to elaborate it further, pictorially


In this screenshot of charts, you can see that the pattern in the chart is repeated and so is the trend that comes after the pattern formation. But both the groups of candles are not alike and nor the volume of bearish trend they had but the direction of the trend was the same. Both are almost 70-80% alike.
For live trade, I’ll be using Margex Exchange to open long/short positions as the professor asked.

In this screenshot from margex exchange we can see that I applied two more indicators with William fractals. Which are Bollinger bands and Ichimoku clouds. With the help of these, I can filter the signal given by William fractals. When William fractal indicated an upward trend, I was not seeing the market but just after two candles I open a long position
HELP OF INDICATORS
Both the indicators helped me in this trade let me elaborate their role one by one.
BOLLINGER BANDS
Bollinger bands were used to make a dynamic resistance. As you can see the price already showed rejection to the support and coming up the median line of Bollinger bands will act as a dynamic resistance while the upper band will be strong resistance.
ICHIMOKU CLOUDS
Ichimoku clouds were used to form a support. As you can see the price is near Ichimoku clouds and as long as it travels in between the clouds it's okay if the could resistance gets breaks then it's good but if the cloud support is getting breaks then it’ll be my exit from the market.

In this screenshot, you can see my buying.

These are the details of the trade that I put just after entering a long position.

In this screenshot again when the selling signal arrives I wasn’t watching the trade and as soon as I saw it and saw that the support from Ichimoku clouds also gets breaks but still the current candle is green I take exit from the market and learned the lesson that one should watch the trade more frequently especially after putting money in it. However, I still got profit. And William's fractal indicator indicates this profit, through it I guess I can keep my portfolio all the way green (obviously if I keep filtering the signals).

Here are the details of the time when I take the exit from the market.
TRADING PAIR: EOS/USDT
AMOUNT: $0.4
LEVERAGE: 80x
PROFIT: $1
CONCLUSION
Trading is a job for many and it's replacing 9-5 jobs. One doesn’t need much capital now to start earning after the introduction of the crypto market. To earn, the traders need analysis, strategies, and indicators to keep their wallets in the greenfield. For this purpose strategies like fractals are very useful. Especially when it's available in William's fractal indicator. This indicator can help traders to win trades even in these sideways markets and bad times of the year. Moreover, miners can also use the William fractal indicator after increasing its value from the setting to ensure that they sell their crypto assets at the best time of the year. For anyone or any time frame, this indicator works because the market repeats itself, and the only smart trader can earn and be beneficial when that much volatile market repeats its price patterns.
I hope I was able to meet all the objectives of this task as I put in all my efforts. So this is the end of my assignment. I hope you were able to grasp the basics of my lecture.
THANK YOU.
ps: All the pictures have been sourced accordingly. The grammar was checked from grammarly.com while the markdowns have been done according to the Markdown Styling Guide.
Cc;
professor @reddileep
regards,
@abdu.navi03
