Steemit Crypto Academy Season 3- Dynamic Course for Beginners - Week 3 | All about Trends, Supports and Resistances and Simple Chart Patterns

Hello Professor @lenonmc21! This lecture has been very educative and I am happy to be a part of it. This my homework post, I hope you enjoy it.

Define in your own words what is a "Trend" and trend lines and what is their role in charts?
TREND
A Trend refers to the continuous rise or fall in the price of an asset within a period of time. A trend can also be defined as the direction with which the price or value of an asset is moving in. A Trend of an asset that continues to rise is called an Uptrend and the Trend of an asset that continues to fall is termed as a Downtrend. Trends are the very basic tools required for technical analysis in the crypto market.
ROLES
- Trends are like the genesis of Technical Analysis.
- Trends make it easy to draw trend lines, the true direction of a Crypto Asset can be determined.
- Trends play the major role in the Technical Analysis of a Crypto Asset.
TREND LINES
A Trend Line on a chart is a line that shows the type of trend, the speed of the asset price and how strong the trend is.
ROLES
- Trendlines play a major role in the drawing of Graphical Patterns for technical analysis.
- Trendlines make it easier to identify the trend of an asset by revealing the price movements on the chart.
- Trendlines are used to determine the strength of a trend and the price speed depending on its steepness.

Explain how to draw an uptrend line and a downtrend line (Show a screenshot of each).
Upward Trend
To draw an Uptrend line, you need to identify two(2) or more bullish points in the trend of the asset and draw a line through them. An example is shown below
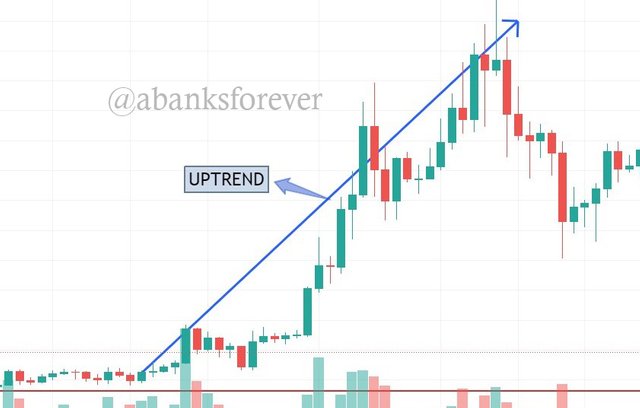
Uptrend | Screenshot from Trading View
Downtrend
To draw a downtrend on a chart, you need to identify two or more bearish points in the trend of the crypto asset chart and draw a line through them.
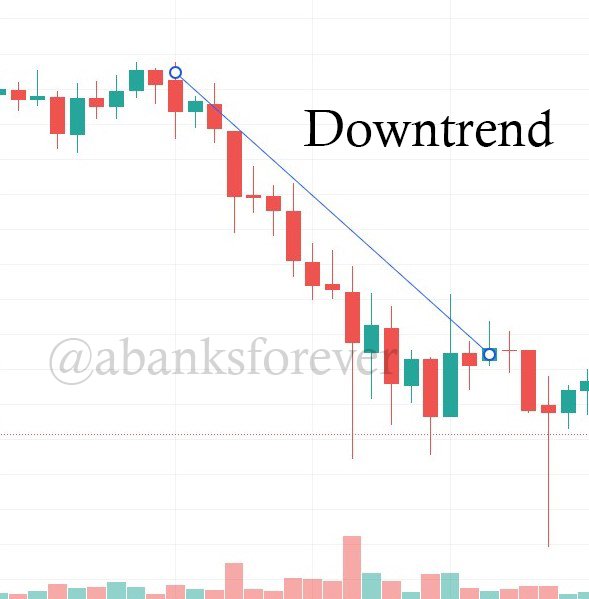
Downtrend | Screenshot from Trading View

Define in your own words what "Supports and Resistances are and how we can identify both zones (Show a screenshot of each one).
Support
This refers to the average Minimum Price Level to which an asset can dip/ fall to. It is called Support because at that price level, traders see the dip in price as a reasonable and profitable price level to start buying and investing in. At this point traders begin to buy the asset and its supply meets its demand. The asset price begins to rise. To be able to identify the Support Zone, You draw the line where the average highest low can be found on the chart, the line should meet at least two to points in the chart.
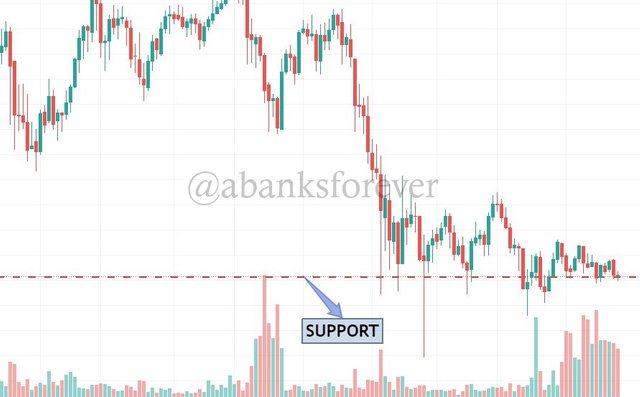
Support | Screenshot from Trading View
Resistance
This refers to the average Maximum Price Level to which an asset can rise to. It is called Resistance because at that price level, traders see the price level as a reasonable and profitable price level to start selling their assets for profits. At this point, as most traders are selling their assets, the supply of the asset becomes greater than its demand and hence, the price begins to dip. To be able to identify a Resistance zone, you draw a line where the average lowest high can be found and the line is supposed to meet at least two points in the chart.
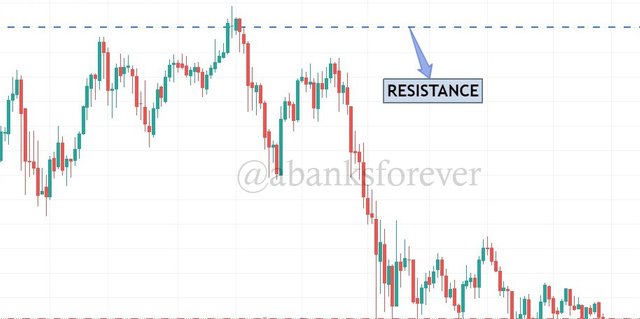
Resistance | Screenshot from Trading View

Explain in your own words at least 2 simple chart patterns with screenshots.
Chart Patterns
Chart Patterns are technical analysis tools that help traders study the behavioral patterns of assets, its price forms and the movements they make due to the demand and supply in the Crypto Market. Patterns can sometimes, if analysed well, can lead to successful trades that may generate great profits. Below are a few examples of Simple Chart Patterns;
- Ascending Triangle
The Ascending Triangle Chart Pattern is a pattern that usually denotes the uptrend or rise in value of a Crypto Asset. It occurs when the bullish trend line touches and makes an angle with the Resistance Line of a Crypto Asset Chart. It takes the name 'Ascending' from the fact that, it occurs when a Crypto Asset's price and value begins to rise towards it's Resistance level. The angle the Uptrend makes with the Resistance Line is what is termed as the Ascending Triangle Chart Pattern.
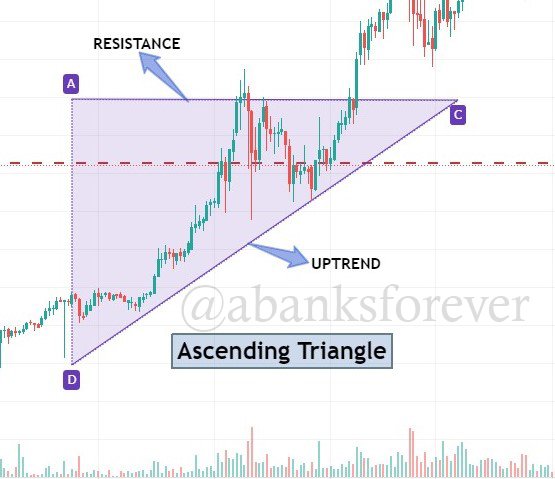
Ascending Triangle Chart Pattern | Screenshot from Trading View
- Descending Triangle
Like its name goes, The Descending Triangle Chart Pattern is a pattern that usually denotes the downtrend or dip in value of a Crypto Asset. It usually occurs when the bearish trend line of a Crypto Asset touches and makes an angle with the Support Line. It takes the name 'Descending' from the fact that, it occurs when a Crypto Asset's price and value begins to dip towards it's Support Level. The angle the Downtrend makes with the Support Line is what is termed as the Descending Triangle.
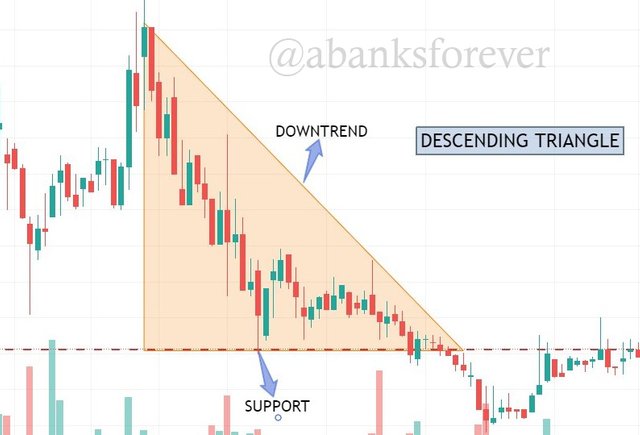
Descending Triangle Chart Pattern | Screenshot from Trading View
- Double Roof
The Double Roof Chart Pattern is a pattern that occurs only in an extensive bullish trend. This usually happens when an asset's price tries to test the Resistance Level but fails on the first occasion. It then oscillates in a sideways trend for sometime before it attempts to test the set Resistance Level again, where it fails yet again and the price drops even much further. It takes the name 'Double Roof' because, at that extensive bullish trend, a new and temporal Resistance and Support levels are set. The uptrend hits the temporal Resistance level(Roof) drops, and then rises again to hit the Roof; to form what is termed as a 'Double Ceiling', before it drops back to its normal trend. This pattern is completed when the price level drops beneath the temporal Support Line (Neck Line). Traders who are able to analyze and notice this pattern seek to sell the Crypto Assets as the next step for the Asset is to lose value.
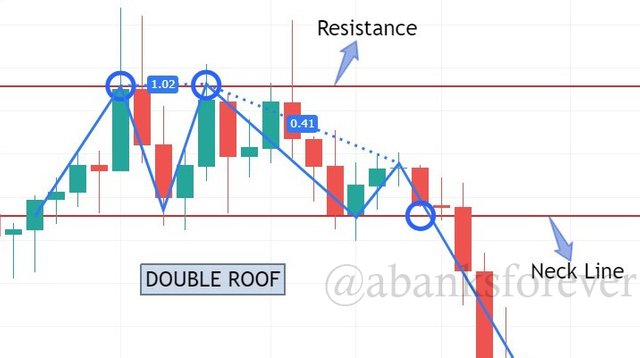
Double Roof Chart Pattern | Screenshot from Trading View
- Double Floor
The Double Floor Chart Pattern is a pattern that usually occurs right before a Crypto Asset's value rises. It is the exact opposite of the Double Roof Pattern. This happens in an extensive bearish trend where the price of the Asset that is experiencing an extensive dip forms it's first bearish peak, slowly rises to hit it's temporal Resistance Line. It then drops again to form it's second bearish peak and then breaks lose of it's temporal Resistance(Neck Line). Some Double Floor patterns may contain more than two (2) Bearish Peaks. After noticing this Pattern, the goal is to buy the Asset, so profits can be generated when the value spikes.
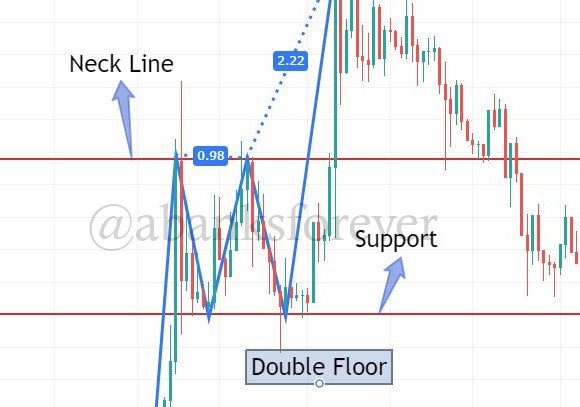
Double Floor Chart Pattern | Screenshot from Trading View
Conclusion
This lecture has broadened my horizon with respect to understanding trends and how to identify certain Simple Chart Patterns, if I see a trading chart of any asset anywhere. I grateful to Steemit and @lenonmc21 for giving us this great opportunity to be a part of this. Thank You.