Tron (TRX) Analysis: May 19, 2024
Current Price: $0.1234 USD
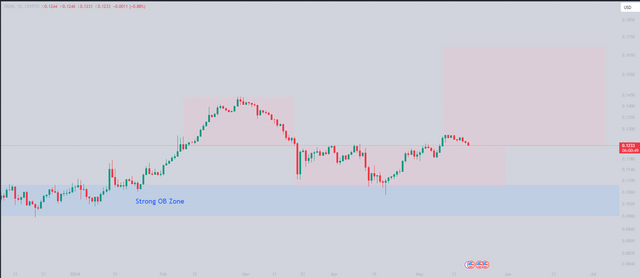
Daily Chart:

Possible Accumulation Zone: The daily chart suggests a potential accumulation zone, where the price may be consolidating before a potential breakout. However, it's important to note that this could also be a manipulation zone, where price movement might be influenced by artificial means.
Higher Timeframes (Weekly and Monthly):

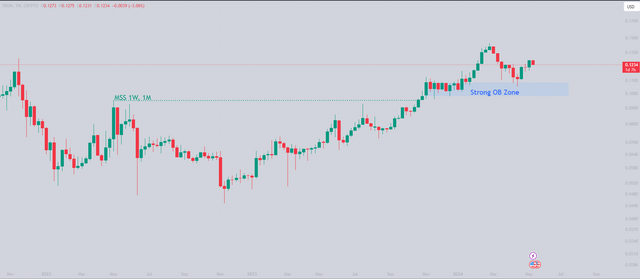
Market Structure Shift: You're correct in pointing out a potential bullish signal on the higher timeframes. Both the weekly and monthly charts hint at a market structure shift with a confirmed break above $0.0905.
Weekly Chart:
Order Block at 0.10 Zone: The identified order block at the $0.10 zone on the weekly chart indicates a previous resistance level. The fact that the price has been rejected from this zone before suggests some potential selling pressure at that level.
Uptrend After Swing Failure: It's encouraging to see the price sustaining an uptrend after a swing failure pattern on the weekly chart. This could be a sign of a potential continuation of the uptrend.
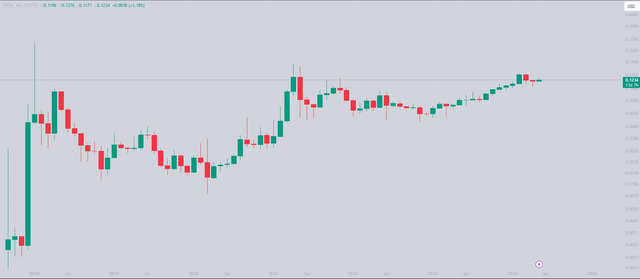
Monthly Chart:

Breakout Formation: The monthly chart suggests a possible breakout formation for an uptrend. However, it's crucial to wait for confirmation with higher trading volume and a decisive break above resistance levels.
Overall:
While the technical analysis suggests potential bullish signals on the weekly and monthly charts, the daily chart's ranging pattern indicates some uncertainty. Here are some additional factors to consider:
News and Events: Look for any upcoming news or events related to Tron that might influence the price movement.
Trading Volume: Monitor trading volume. A significant increase in volume alongside a breakout could be a stronger confirmation of an uptrend.
Disclaimer: This analysis is for educational purposes only and should not be considered financial advice. Investment decisions based on this information are at your own risk and discretion.