Steem (STEEM) Analysis: May 23, 2024
Current Price: $0.2817 USD (24-hour volume: $2.6 million)
Volume Decrease: You're right to point out the significant decrease in trading volume (49%) over the past 24 hours. This could indicate a lack of market interest or a potential lull before a breakout.
Historical Comparison (2020): While Steem's current price movement might resemble the 2020 ranging period with low volume, it's important to avoid directly comparing historical data to predict future trends. The market landscape can evolve significantly over time.
Daily Chart:
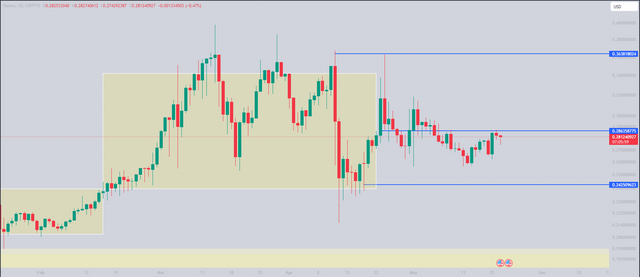
Potential Short-Term Upswing: The daily chart suggests a possible move towards $0.30, followed by a potential pullback to $0.24. However, this is just one scenario, and confirmation is needed through continued price action.
Weekly Chart:
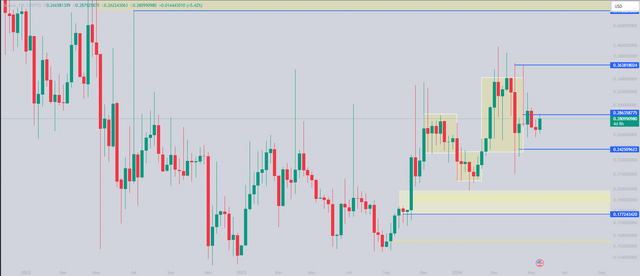
Consolidation Zone: The characterization of the current price zone as a "combination zone" is interesting, but it might be more accurate to describe it as a consolidation zone. A true combination zone typically involves both bullish and bearish signals, while consolidation suggests a period of indecision.
Correction or Manipulation?: The possibility of a correction to $0.18 on the weekly chart is a potential scenario. However, it's difficult to definitively say whether this would be manipulation or a natural market correction.
Monthly Chart:
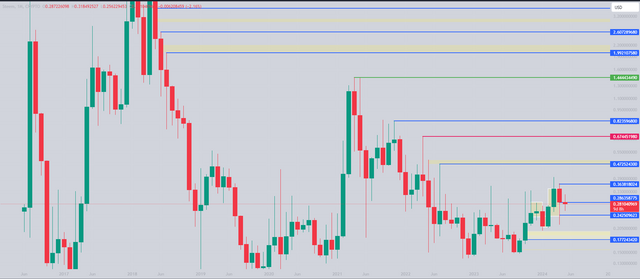
Bearish Swing Failure Pattern (Unconfirmed): You've correctly identified the bearish swing failure pattern on the monthly chart. However, it's crucial to note that this pattern is not confirmed until the end of the month. A monthly candle closing above $0.31 would invalidate the pattern.
Overall:
Steem's price analysis presents a scenario with some uncertainty.
Short-term (Daily): Potential short-term upswing followed by a pullback, but confirmation is needed.
Mid-term (Weekly): Consolidation zone with a possibility of correction, but the nature (manipulation or natural) is unclear.
Long-term (Monthly): Unconfirmed bearish swing failure pattern on the monthly chart.
Key Levels to Watch:
Upside Resistance: $0.30 (daily chart)
Downside Support: $0.24 (daily chart), $0.18 (weekly chart)
Monthly Candle Close: Watch the closing price of the monthly candle to see if it confirms or invalidates the bearish swing failure pattern.
Disclaimer:This analysis is for educational purposes only and should not be considered financial advice. Investment decisions based on this information are at your own risk and discretion.