Mantle (MNT) Price Analysis: May 21, 2024
Current Price: $0.9598 USD (24-hour volume: $50 million)
Daily Chart:

Downtrend with Higher Lows: The daily chart suggests a downtrend with "higher lows" being formed. This indicates that while the overall trend is downward, the selling pressure is potentially weakening. The recent ranging behavior between $1.00 and the sell-side order block at $0.87 could be a sign of consolidation before a potential trend change.
Weekly Chart:
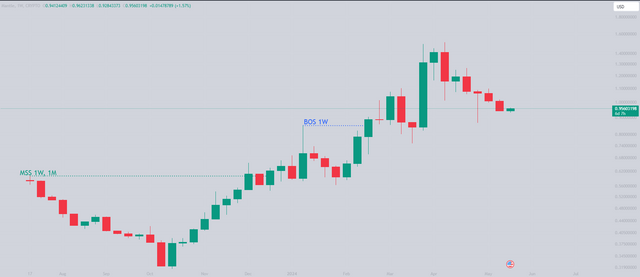
Filling Imbalance: You're correct in pointing out that the weekly chart shows the price filling the imbalance at $0.87. However, confirmation of a bottom remains elusive.
Bullish Structure (Conditional): The statement that the price structure remains bullish as long as it holds above $0.74 needs some clarification. A true bullish structure typically involves higher highs and higher lows. In this case, while the price is above $0.74, the overall downtrend suggests a need for a confirmed trend reversal before a bullish structure can be established.
Monthly Chart:

Market Structure Shift: The monthly timeframe presents a more optimistic view, with a confirmed market structure shift at $0.54. The current price range of $0.96-$1.35 aligns with this potential long-term bullish zone.
Overall:
Mantle's (MNT) price analysis reveals a complex picture.
Short-term (Daily): Downtrend with signs of potentially weakening selling pressure.
Mid-term (Weekly): Imbalance filled, but bottom unconfirmed. Conditional bullish structure based on current price remaining above $0.74.
Long-term (Monthly): Confirmed market structure shift suggests a potential long-term uptrend.
Key Levels to Watch:
Upside Breakout: A decisive break above the daily resistance level of $1.00 could signal a reversal of the downtrend and a potential move towards the higher end of the monthly range ($1.35).
Downside Support: If the downtrend continues, pay attention to the $0.74 level (daily chart) to gauge potential buying opportunities or a confirmed break of the bullish structure.
Disclaimer: This analysis is for educational purposes only and should not be considered financial advice. Investment decisions based on this information are at your own risk and discretion.
You've got a free upvote from witness fuli.
Peace & Love!