Hashflow (HFT): Unveiling Price Movements, Potential Breakouts, and Trading Strategies
Hashflow (HFT) stands as the native governance token of Hashflow, a decentralized exchange (DEX) aggregator that empowers users with seamless access to a vast liquidity pool of approximately $8 billion. This innovative platform facilitates seamless token trading across various blockchains, eliminating the need for token bridges and enabling users to execute trades on their preferred chains.
Technical Analysis: Unraveling Price Trends and Trading Opportunities
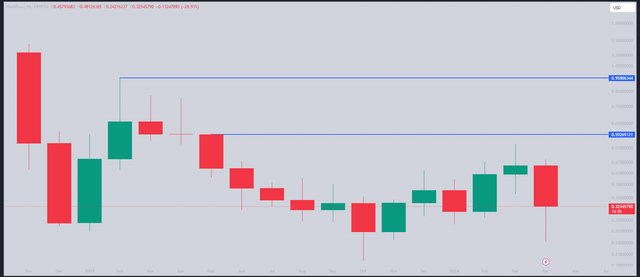
Monthly Chart: Healthy Correction and Uptrend Potential
The monthly chart reveals a recent substantial correction of over 50%, indicating a healthy market adjustment. This correction has set the stage for a potential upward trajectory in the higher time frames.

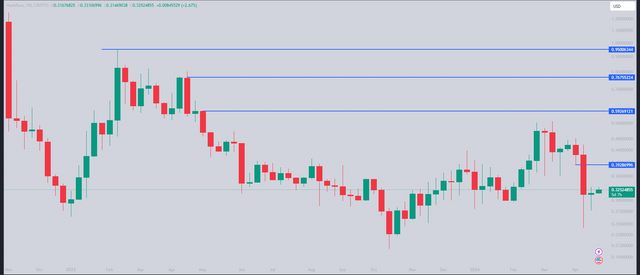
Weekly Chart: Unveiling Imbalances and Potential Breakout Signals
Examining the weekly chart, an imbalance zone is evident between $0.30 and $0.39. As the market addresses this imbalance, a shift in market structure will become apparent, indicating the direction of price movement. Additionally, liquidity levels are observed at $0.59, $0.76, and $0.95 on the upside.

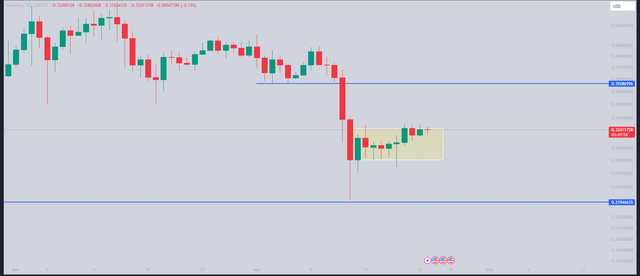
Daily Chart: Ranging Structure and Potential Price Deviations
The daily chart presents a ranging structure with a range high of $0.324 and a range low of $0.285. This consolidation phase suggests a potential for price deviation as the price establishes its base.

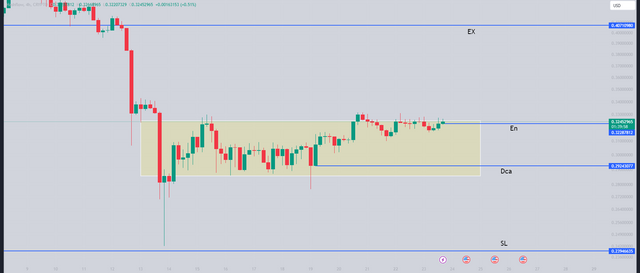
Short-Term Trading Strategy
For short-term profit opportunities, an entry point can be considered at $0.323. A DCA (Dollar-Cost Averaging) zone can be established at $0.29. A stop-loss order should be placed at $0.239.

Disclaimer
It is crucial to emphasize that this analysis is solely intended for educational purposes and does not constitute financial advice. Any investment decisions based on this information are at your own discretion and risk.