Chainlink (LINK) Analysis: May 17, 2024
Current Price: $16.31 USD (24-hour volume: $1.4 billion)
Daily Chart:
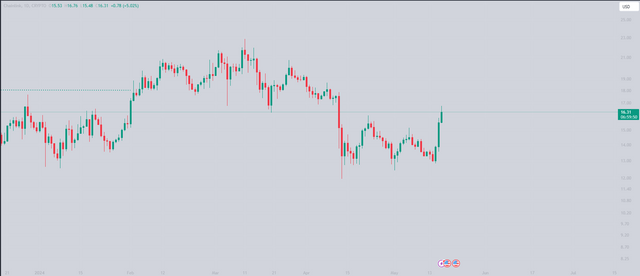
Rangebound: The daily chart suggests a rangebound price movement between $16.662 and $12.39. This consolidation phase could indicate potential opportunities for scalping strategies.
Fibonacci Ratio:
Premium Zone: While you mentioned the Fibonacci ratio indicating a "premium zone," it's important to remember that technical indicators like Fibonacci retracements are not always definitive predictors of future price movements.
Higher Timeframes (Weekly and Monthly):
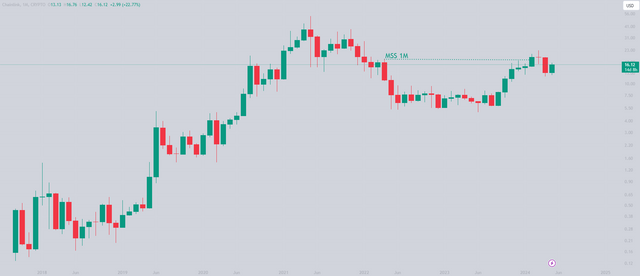
Faked Breakout: You're right to point out the potential for a "fakeout" in the higher timeframes. Both the monthly and weekly charts hinted at a possible market structure shift with a break above $18, but the subsequent price correction suggests a failed breakout.
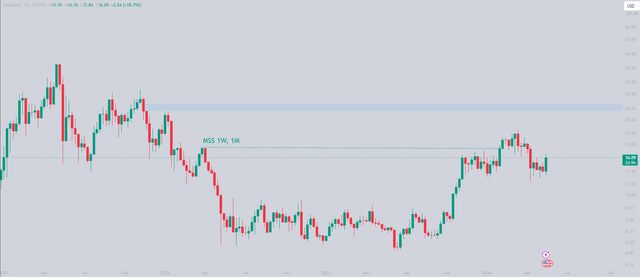
Swing Failure Pattern (Weekly):The swing failure pattern around the $23 level on the weekly chart indicates a loss of upside momentum. This could be a sign of a potential downtrend or further rangebound movement.
Breakout Confirmation: A decisive break above $22 with a strong bullish candle on the weekly timeframe could signal a renewed uptrend.
Range Support: If the price continues to range, pay attention to the support level around $12.39 (daily chart) to gauge potential buying opportunities.
Disclaimer: This analysis is for educational purposes only and should not be considered financial advice. Investment decisions based on this information are at your own risk and discretion.