Analyzing Tokocrypto Token: Insights into Market Trends and Entry Points
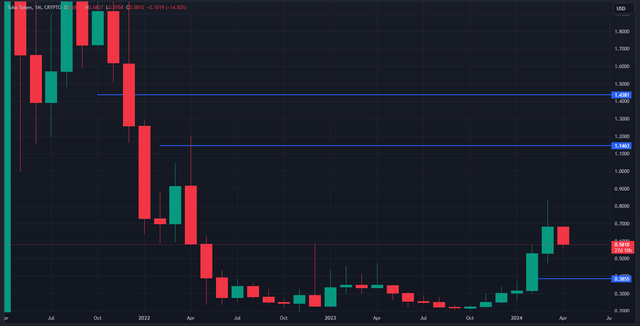
Today, let's analyze the Indonesian token Tokocrypto and examine its trends. Firstly, let's open the monthly chart. Over the past five months, it has been predominantly bullish. Last month, it reached approximately $0.85. On the higher timeframe, there's an imbalance at the 0.38 level. If bearish movements emerge in the market, this imbalance could be filled. Conversely, if bullish momentum continues, it could reach up to $2.67.

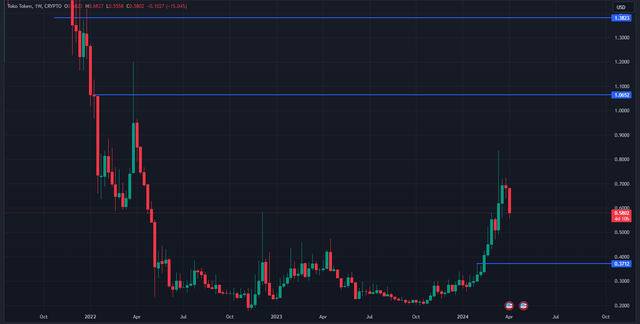
On the weekly timeframe, it has created a divergence. Although this week hasn't completed yet, confirmation could be obtained with the completion of the last week. The price may retrace a bit to $0.50.

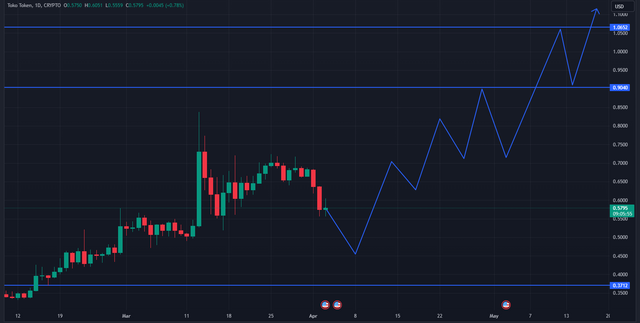
Looking at the daily timeframe, it's currently moving within a range, with the range high at $0.80 and the range low at $0.50. Now, the market might undergo a slight retracement, reaching $0.70, $0.80, $0.90, and possibly $1.00. Now, the question arises: where should we enter?

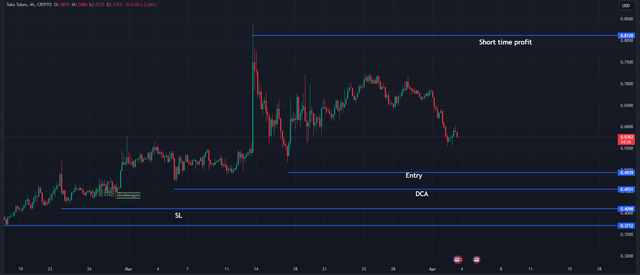
For entry points, let's open the four-hour chart. Here, it's still within an accumulation zone. If it confirms manipulation, meaning it crosses below 0.50, then the entry point would be at $0.49, with a Dollar-Cost Averaging (DCA) point at $0.45. Set the Stop Loss (SL) at $0.40.
