Burnsteem25 : AAVE (AAVE) Price analyst for future trading #30
Hallo teman teman selamat datang kembali di post update teknikal analisa terlengkap di komunitas steemit ini, kembali lagi bersama saya Jerry Madez yang akan melakukan analisa teknikal pada satu token yang cukup menarik kiranya untuk kita mengambil peluang profit, yaitu pada token AAVE. Mari kita lanjut ke pembahasan chart analisanya berikut.
Hello friends, Welcome back to the most complete technical analysis post update in this steemit community. Back again with me, Jerry Madez, who will do technical analysis on a token that is quite interesting for us to take profit opportunities on, namely the AAVE token. Let's continue to discuss the following chart analysis.
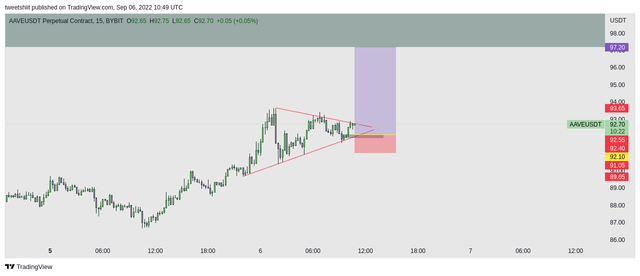
Pada chart diatas, terlihat adanya pembentukan pola yang disebut Bullish Pennant, atau yang biasa di identifikasikan oleh kebanyakan trader adalah pola pelanjutan harga. Artinya kita disini melihat sebelum pembentukan harga pola ini terbentuk karena adanya pelanjutan harga keatas.
On the chart above, you can see the formation of a pattern called Bullish Pennant, or what most traders usually identify as a price continuation pattern. This means that we are here to see that before the formation of the price, this pattern was formed because of the continuation of the price upwards.
Dan disini pada zona box yang jadi entry point kita yang jadi order block, area ini menjadi krusial bagi bagi saya. Apabila harga berhasil break maka entry posisi saya akan berubah, dan saya akan melakukan pembelian pada saat breakout terjadi. Namun meski pun ini belum terkonfirmasi breakout saya agak mengambil resiko untuk posisi entry, tetapi saya memanage resiko untuk posisi ini.
And here in the box zone, which is our entry point which becomes the order block, this area is crucial for me. If the price breaks, my entry position will change, and I will buy when the breakout occurs. However, even though this breakout has not been confirmed, I take a bit of risk for the entry position, but I manage the risk for this position.
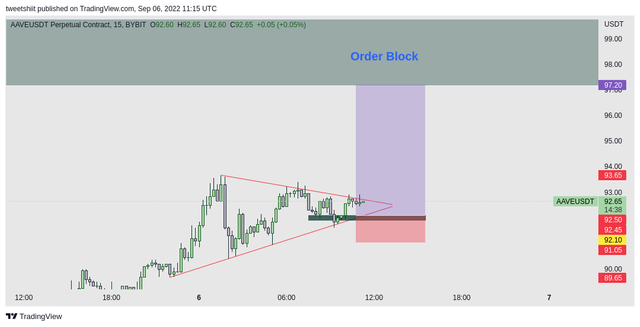
Jadi untuk take profit area, saya mengambil area order block yang yang menjadi selling presure. Area tersebut bagi saya sangat lebar dan sangat kuat terjadi reaksi harga. Dan bisa jadi area tersebut nantinya akan menjadi sell posisi apabila memungkinkan untuk kita entry.
So for the take profit area, I take the order block area, which is the selling pressure. The area for me is very wide and there is a very strong price reaction. And it could be that this area will later become a selling position if it is possible for us to enter.
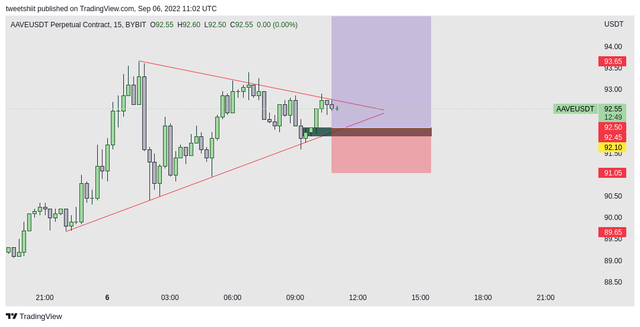
Oke untuk detail entry, stoploss dan target sesuai dengan yang dibawah ini.
Okay, for the details, enter the stop loss and target as shown below.
Entry : 92.10$
Stoploss : 91.05$
Take profit : 97.20$
Perlu diingat analisa saya ini saya khususkan untuk derivatif market, namun apabila dipakai untuk spot market saya kurang menayarankan kali ini, karena jarak take profit cuma 5.5% saja dari pergerakan harga
Keep in mind that my analysis is specifically for the derivative market, but if it is used for the spot market, I don't recommend it this time, because the take profit distance is only 5.5% of the price movement.
REMINDER
Meskipun analisa yang kita temukan banyak memberikan signal dan konfirmasi, tetap harus di ingat untuk melakukan managing resiko trading, tak bosan bosan saya selalu ingatkan hal ini karena hal ini sangat penting dan krusial apabila kita melakukan trading pada future market. Resiko, resiko dan resiko. So gunakanlah 1% dari total equity kalian untuk menjadi resiko apabila analisa ini gagal agar ketika mengalami kegagalan kita cuma kehilangan 1% saja dari kapital gain nya kita. Dan untuk Reward, saya melihat ada potensi reward dari analisa ini 1 : 4.8, dan ini sangat bagus.
Even though the analysis that we find provides many signals and confirmations, it must be remembered to manage trading risks. I don't get bored, I always remind you this is very important and crucial when we trade in the futures market. Risk, risk, and risk. So use 1% of your total equity to be at risk if this analysis fails, so that when we fail, we only lose 1% of our capital gain. And for rewards, I see there is a potential reward from this 1 : 4.8 analysis, and this is very good.
Oke sekian dari saya, terimakasih kepada teman teman yang sudah meluangkan waktu untuk membaca artikel ini, oh ya. Untuk data analisa data saya mengambil dari chart Bybit.
Okay, that's all from me. Thank you to friends who have taken the time to read this article. Oh yes. For data analysis, I take the data from the chart Bybit.
Dan juga untuk admin dan moderator Steem SEA @anroja @waterjoe @steem.amal @radjasalman saya ucapkan terimakasih karena selalu mensupport blog saya yang spesisifik membahas tentang teknikal analisa, saya berharap postingan ini jadi edukasi untuk teman teman di komunitas atau diluar komunitas juga, dan jadi panduan awal untuk terjun ke dalam future market.
And also for admins and moderators Steem SEA @anroja @waterjoe @steem.amal @radjasalman I thank you for always supporting my blog, which specifically discusses technical analysis. I hope this post can be educational for friends in the community or outside community as well, and be an initial guide to plunging into the futures market.
The reward from this article will be donated 25% to @null for the development of the Steemit community.
Terimakasih telah berbagi bersama disini.