How to Calculate Correlation in Excel with the Data Analysis ToolPac
Correlation is a statistical measure that shows how two variable might move together. For Example as the price goes down, the sales volume might go up. Or, as the weather gets warmer, sales volume might decrease. These types of correlation might be obvious in some organisations, but looking at the correlation between different data sets can revile interesting and actionable insights for a business.
Mapping these sort of trends has become common practice for businesses looking for key insights from their data. But for many of us, working with data in this way is new. Analyzing data in Excel for many has meant producing some sort of historical report. Maybe a chart or two and a little guesstimate forecasting.
As the data trend explodes and terms like correlation coefficient get thrown about more often in business I thought it was time to explore this area in Excel. After all, Excel users work with data every day. If this is where things are moving then we can’t get left behind.
In this week’s video we will look at how we can use Excel to calculate the correlation between sets of variables. This is not a lesson on correlation but how to carry out correlation using Excel.
If you want to learn more about correlation then I would suggest you read a little more on Wikipedia
Excels Data Analysis Toolpak add in
Correlation in Excels is calculated using the Data Analysis toolpak add in. To turn on the add in, got to file, then options then go to add in’s. In Excel Add in’s, select Analysis tool pack.

Once you have turned on the Analysis Toolpak in Excel, you will find a new option in your data ribbon.

How to Calculate Correlation Coefficient using Excel
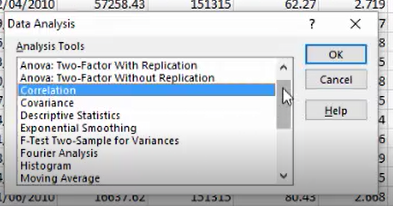
Select Data Analysis from the data ribbon. A dialogue box will open with a suite of Data analysis statistical calculations. As we are looking at the correlation between variables we will select Correlation.

Selecting Correlation will open a new dialogue box.

First you need to select your Input Range. This is the range that contains all the values for the set of variables in which you are testing for correlation. If your data is going down the rows, so you have columns of data, the select Grouped by Columns. Should the data be presented across the rows then select Grouped by Rows.
If your data has headers, then also select Labels in First Row. You then need to select where you want your output to be placed.
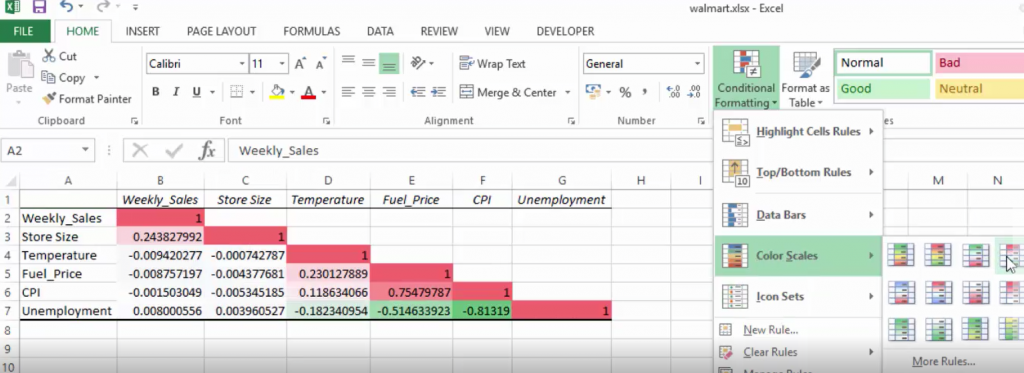
In the background Excel works its magic and returns a table with a correlation coefficient value between variables. The values returned are between -1 and 1. A strong positive correlation will show a value close to 1. Whereas a strong negative correlation will show a value close to -1.
If you are working with multiple variables, the table results might not be so easy to read quickly. To over come this can add some conditional formatting to our correlation table. That way strong positive and negative values can be easily seen.
Do you want to start collecting rewards quickly for learning Excel? Then you should try:
10+ Excel Learn and Earn Activities YOU can do Today
Cross posted from my blog with SteemPress : http://theexcelclub.com/correlation-excel-data-analysis-toolpac/
Awesome article. I’m interested in getting the add in. I wonder if I could use it for something for my work. Perhaps to show efficiency using decreased turnaround times somehow.
the add in just needs to be turned on and you are good to go :-)
I got the add in and I included the VBA one as well. It's got lots of stuff in it! I'm still trying to get the information to work, I can't quite figure out how to input the values and get a valid output. Pretty cool stuff!
Did you figure it out?
I’ll give it a whirl next week and let you know. Should be a slow week hopefully so I can do some messing around.