Trillions of market capitalization has become an important support for BTC?
Bitcoin market overview
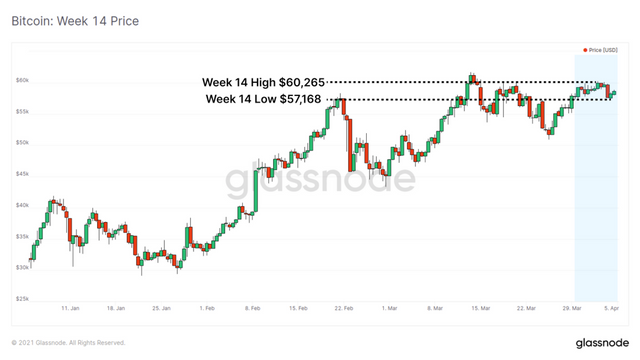
The Bitcoin market traded in a relatively narrow 5.4% range this week, with a minimum of 57168 USD and a maximum of 60265 USD. Bitcoin has now reached the milestone of $1 trillion in market value for a full week. To maintain this position, all Bitcoins will exceed $53,566. This is strong confidence in Bitcoin and the entire cryptocurrency asset class.
On-chain activities continue to reinforce this position, with transaction volumes equivalent to more than 10% of the circulating supply above the $1 trillion threshold. At the same time, the miners have returned to the mode of hoarding coins, and the indicators on the chain have almost reset. Interestingly, open futures contracts have reached a new all-time high, while trading volume and short liquidation volume are declining.
Trillions of market capitalization has become an important support level
Now that Bitcoin has entered the trillion-dollar market capitalization field, the immediate question is whether the market can maintain these levels and how much price support is below us.
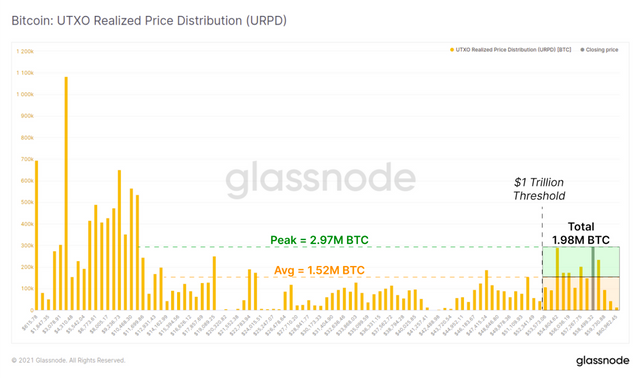
The URPD indicator shows the distribution of the transaction volume on the chain in the price group, and forms the transaction volume curve indicator that is often used in technical analysis: the transaction volume on the chain. When there is a large amount of currency trading volume in a certain price band, it is likely to form a strong support (or resistance) level.
Above the threshold of 1 trillion dollars in market value, more than 1.98 million BTC have been traded, which is equivalent to 10.6% of the circulating supply. What is impressive is that this on-chain transaction volume has formed one of the strongest on-chain support levels since the price of 11,000 to 12,000 US dollars.
The peak volume of this range reached 2.97 million BTC, and the transaction price was between US$58,500 and US$59,100. The average trading volume in this range is 1.52 million BTC, which is also higher than most ranges. This trading volume range is likely to form a very strong support level, which seems to prove Bitcoin's trillion market value status.
URPD real-time graph
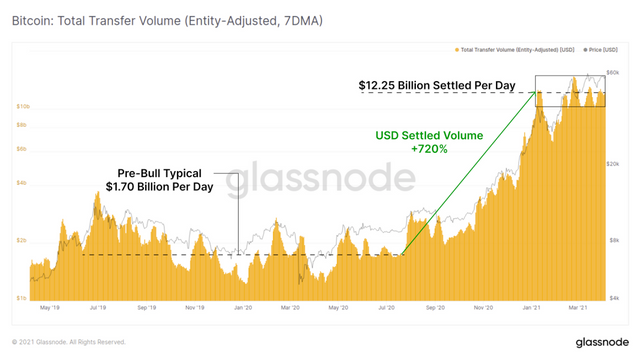
To support this view, we reviewed the total transaction volume denominated in US dollars over a period of time. The following figure uses Glassnode's entity adjustment algorithm (EA), which is used to filter out transfers that are considered to be of no economic significance (such as internal exchange transactions and self-transfers).
From 2019 to mid-2020, the daily EA settlement volume of the Bitcoin network is usually around $1.7 billion. Since then, the transaction volume on the chain has risen together with the price by more than 720%, and the value of the EA that is settled every day is typically US$12.25 billion. This means that even though the currency price has risen sharply, the transaction volume has also increased correspondingly to support and prove the performance of the bull market.
Real-time graph of the adjusted total transfer volume of the entity
On-chain situation
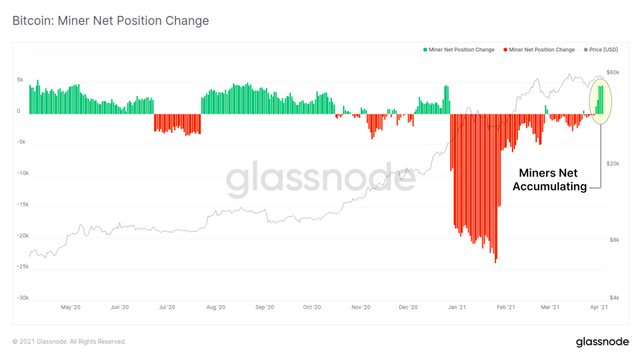
Last week we showed how long-term holders have slowed their selling behavior in the past three months, and this trend has continued into this week. In addition, miners have now joined in, and the miner net position change indicator flashes green, indicating that the miners are holding newly mined coins.
Although the influence of mining as a seller entity is getting smaller and smaller (compared to daily transaction volume), their consumption patterns can provide insight into the sentiment in the Bitcoin market.
Real-time graph of changes in miners' net position
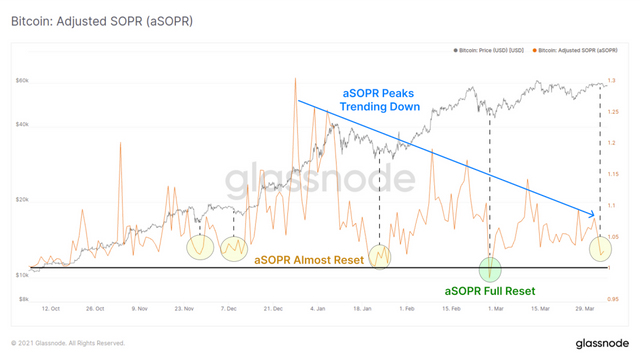
The adjusted SOPR indicator can give us an in-depth understanding of how much profit is realized by the coins sold every day (while ignoring coins less than 1 hour). If profits are taken away by old coins, aSOPR (Adjusted SOPR) will show an upward trend, on the contrary, when profitable coins remain dormant, aSOPR will show a downward trend.
The higher the aSOPR indicator, the more currencies are profitable.
When aSOPR is lower than 1.0, it means that the coin is in a state of total loss.
In a bull market, we usually see a "reset" of aSOPR, that is, during a price correction, aSOPR returns to a level close to or below 1.0. This indicates that profitable coins are staying dormant, and the confidence in holding assets is recovering.
The aSOPR chart below shows two key observations.
aSOPR was almost reset to 1.0 this week, indicating a reduction in profitability and that market confidence still exists.
The consecutive peaks of aSOPR have decreased in the past three months. This shows that with the progress of the bull market, profits have decreased, again showing the long-term trend of market confidence.
Adjusted SOPR real-time graph
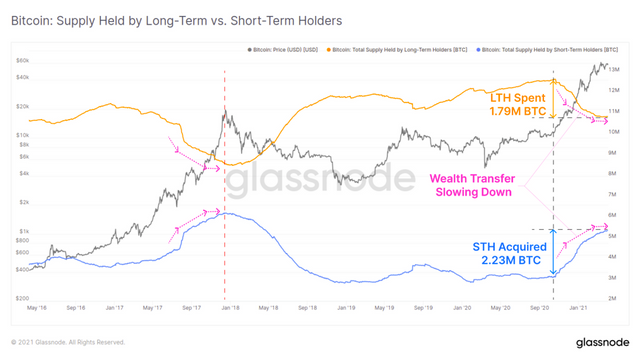
Finally, we reviewed the wealth distribution between long-term holders (LTH) and short-term holders (STH), which is usually a cyclical indicator of wealth transfer events.
This analysis pointed out some key observations.
The BTC accumulated by STH in the past 6 months is about 440,000 more than the cost of LTH, which shows that the new demand entering the market has exceeded the sales volume of LTH.
As shown in pink, the relative wealth transfer is slowing down. This is because long-term holders have slowed down selling.
A similar wealth transfer occurred near the peak in 2017, so this is an indicator worth paying attention to. This may be both a supply constraint (bullish), but it also indicates a cyclical change in holding behavior.
A key difference from 2017 is that LTHs currently hold 66% of the circulating supply, which is much higher than the 58% at the peak of 2017. This shows that compared with the historical cycle, the holding demand in this cycle has increased. On the contrary, there are more currencies in profit, which may become an overhead supply in the future.
Real-time chart of relative holdings of LTH and STH
In general, in the past few weeks, the strength and demand of holding coins in the bull market have been very significant. This trend continued to a large extent this week, with both miners and long-term holders showing positive signs, and trading volumes also supported the new trillion-dollar valuation.
The above analysis considers the spot market and on-chain traffic. Since this is the first widely used derivatives market in the Bitcoin bull market, we will also study the futures market to evaluate the overall performance of the derivatives market.
Futures trading
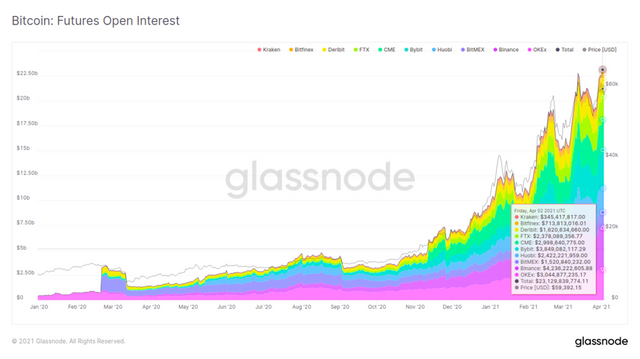
Open futures contracts hit a record high this week, exceeding $231 billion, of which Binance and OKex together accounted for 32% of all contracts.
Futures opening price firm chart
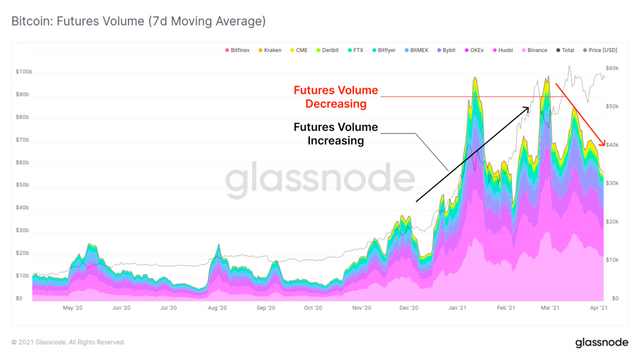
Interestingly, the futures trading volume has been declining throughout March, and this week has been particularly calm compared to the previous few months.
Real-time graph of futures trading volume
Perpetual futures funding rates are also almost reset to neutral levels, indicating a reduction in excessive long speculation and an increase in short interest, which balances long traders.
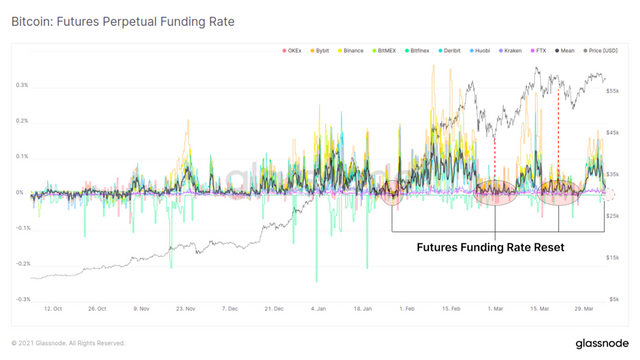
Futures Fund Interest Rate Firm Chart
In the past few months, although the liquidation volume of short sellers has reached a record high, their liquidation volume has gradually declined. This shows that short sellers either have excellent risk management in a bull market, or, more likely, many short sellers have deployed risk-neutral strategies in their trading.
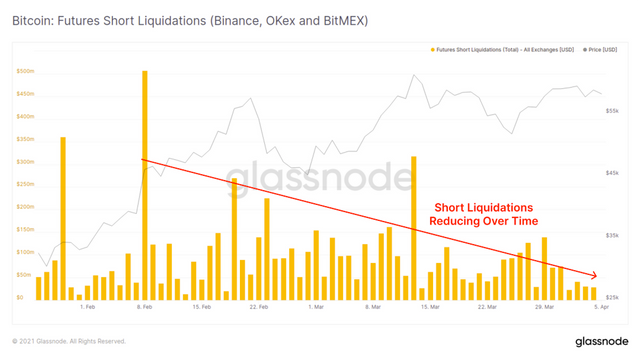
Short liquidation firm chart
The combination of high open interest, reduced futures trading volume, small short-term liquidation volume, and lower funding interest rates proves that "cash and carry" trading is the preferred strategy under current market conditions.
Hold and carry trading allows traders to combine spot longs and short futures to lock in the current funding rate/premium while remaining risk-neutral to price fluctuations. As more and more traders take advantage of this arbitrage, short interest in open positions will increase, but since traders keep their net worth neutral by holding spot, there is no corresponding liquidation.
Weekly Topic: Compound Token
This week, DeFi Token regained people's interest, which was reflected in both the price increase and the early signs of re-growth of on-chain activities.
Especially the Compound Protocol (COMP), as the Token price approaches the last ATH set in early February 2021, it performed very strongly this week. This week, COMP added another 23,000 non-zero balance holders, bringing the total to more than 148,000 addresses, an increase of 1.5%. During the same period, the price of COMP Token increased from US$227 to more than US$540, which more than doubled.
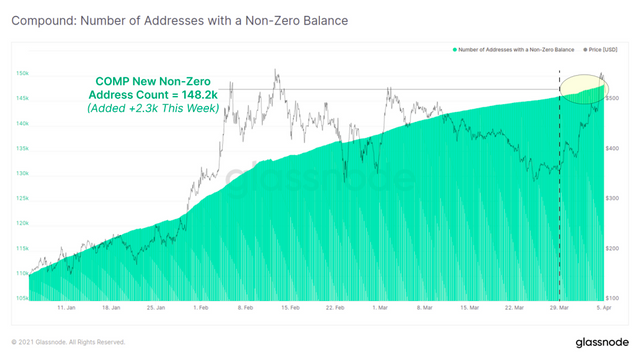
COMP non-zero address count real-time chart
At the beginning of March, on-chain activity stalled, and the trading volume of COMP has also steadily increased in the past two weeks. Currently, there are 200,000 to 300,000 COMP transactions every day, which is close to the transaction volume when COMP hit an all-time high of $564.81 in early February.
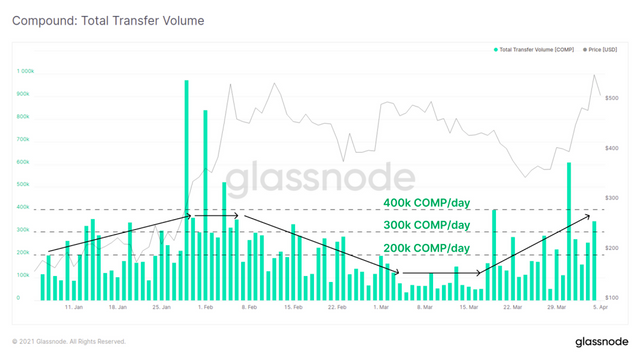
Real-time chart of COMP trading volume
Finally, in the past two weeks, the balance held by the exchange also increased with the price of Token. Another 41,100 COMP was deposited on the exchange this week, and the exchange balance increased by about 20%.
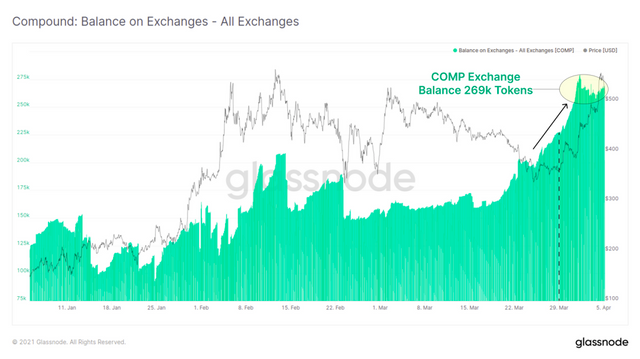
Real-time graph of COMP exchange balance
images from Glassnode