Bitcoin (BTC) Extreme Fear Now What?
Introduction
Hey friends, hope you're well! Welcome to the new update on Bitcoin. In this article, we will analyze the latest movements in Bitcoin, focusing on the Fear and Greed Index, bullish divergence signals, and exchange reserves. This analysis is based on the latest trends observed in the market.
Fear and Greed Index Analysis
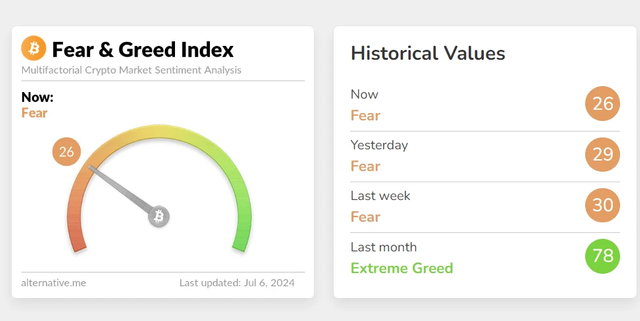
In my earlier video shared a few hours ago, I highlighted that fear in the market has increased. The Fear and Greed Index had dropped to 29, the lowest value since September 2023. As of today, it has decreased further to 26, reaching the lowest values since January 2023.
Historical Comparison
By placing a trend line and looking back to January 2023, we can see that similar low values were observed. During that time, bulls took it as an opportunity and started buying, leading to a massive rally. We are now touching those levels again, suggesting a potential opportunity for a similar rally.
Bullish Divergence and Price Movement
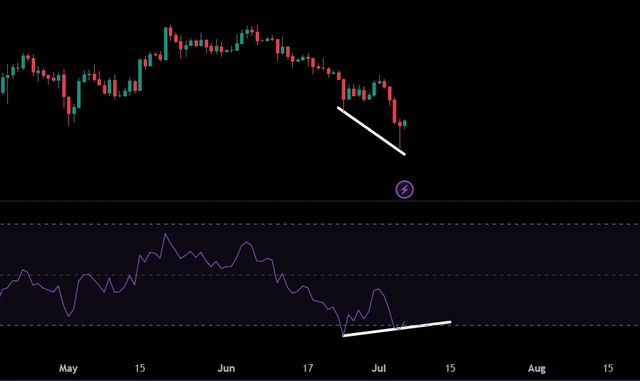
In today's analysis, we will review the bullish divergence that I mentioned in my previous video. Despite the price drop, the RSI oscillator was forming higher lows, while the price line was forming lower lows. This bullish divergence signal was followed by an upward movement in the price line, and we are currently moving at this support level.
Exchange Reserves Analysis
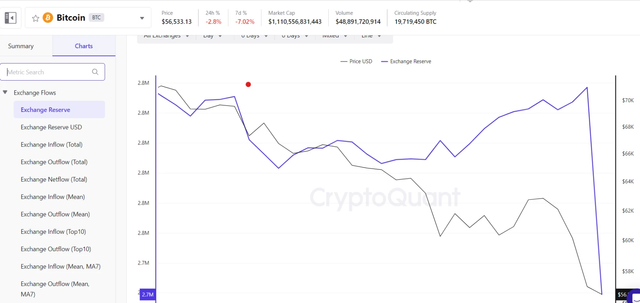
We will also look at the chain analysis, focusing on exchange reserves. There has been a significant drop in exchange reserves, indicating a reduced supply of BTC on exchanges, which could lead to a price increase.
Live Chart Analysis
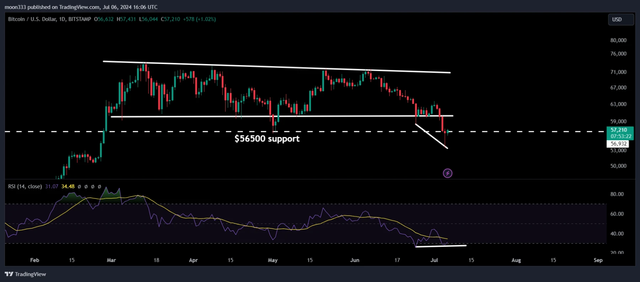
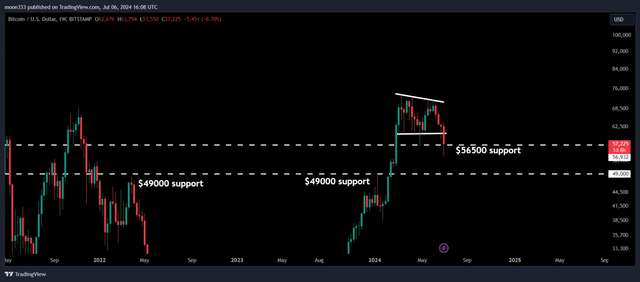
Let's take a look at the live chart of Bitcoin. On the daily time frame, we have broken down the support of a descending triangle that Bitcoin was moving inside for several days. The support level at $56,500, the lowest price in May 2024, is significant. A bullish divergence on the RSI suggests a potential price recovery, as the RSI has entered the oversold zone.
Support Levels
If the support at $56,500 is broken, the next significant support level is at $49,000, which has previously acted as both support and resistance. On the weekly time frame chart, this level has shown its significance, particularly in April 2022.
Conclusion
Today, the Fear and Greed Index dropped further to 26. Historically, similar low values have led to significant buying and rallies. With the current bullish divergence and the drop in exchange reserves, there is a probability of a recovery rally. However, it is crucial to monitor the daily closing prices to confirm the support levels.
Additional Resources
For more trading signals and to support my work, you can join me as a YouTube member or a Patreon member. Links to join are as below:
https://www.youtube.com/c/moon333/join
https://www.patreon.com/moon333