Cryptocurrency Trading Lecture 3: Candlesticks
You are welcome to my 3rd lecture on Cryptocurrency Trading.
In the previous lectures, I have discussed what financial market is and the different type of markets. I also explained what instruments and tickers are. In the previous lectures, I have also talked about the 3 types of analysis a trader can choose to work with to analyse any market which are technical analysis, fundamental analysis and Sentimental analysis.
I have discussed technical analysis and showed us different ways of representing price on a chart in a market.
The links to the previous lectures is and the end of the post, so all that missed the previous lectures can read up the lectures.

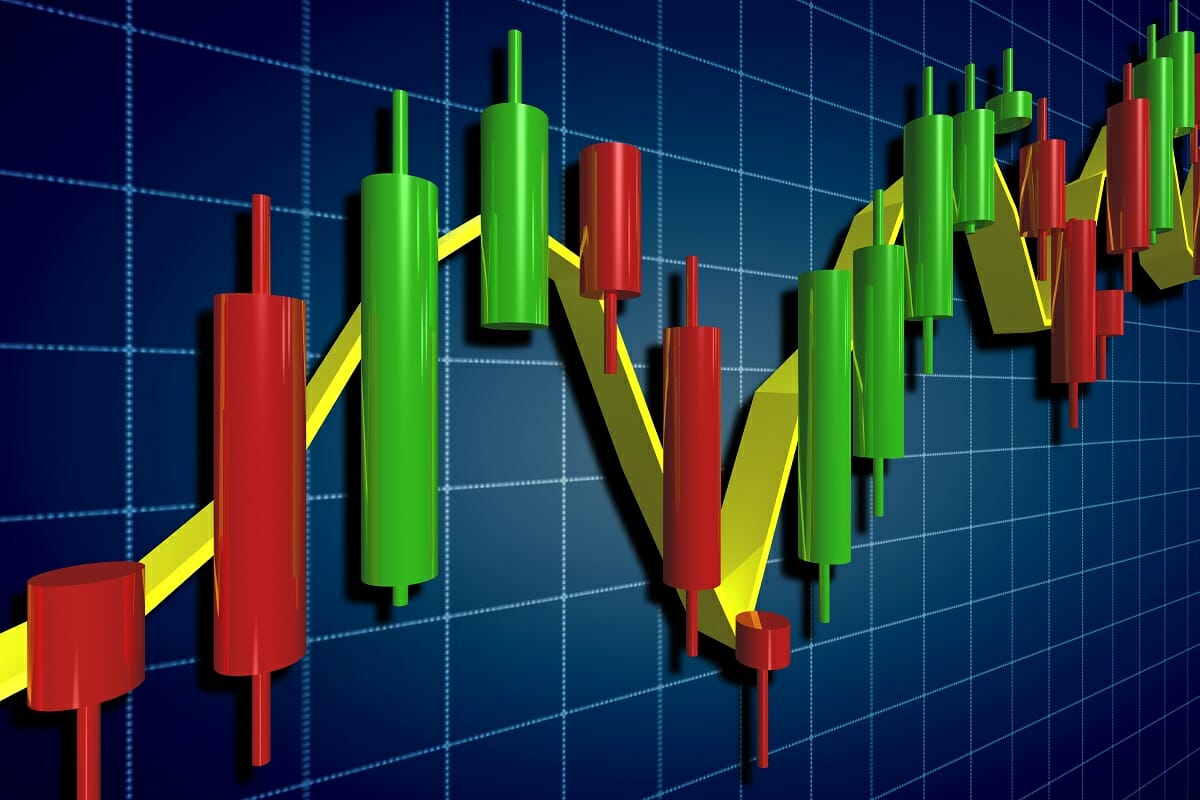
Today, I am going to discuss about Candlesticks. Remember I mentioned in my last lecture that of all these styles of representing price on a chat in a market, the most commonly used style is Japanese Candles.
Before I continue let me inform those that don't know that one of the sites you can get information about all the market in the world is https://www.tradingview.com
Candlesticks is the most popular used style of all the ways of representing price on a chat in the market.

Just like we have in the normal candle we all know, we have the body and the thread. So also in this candle we use to represent price on trading charts, we have the body and something like the thread called the wick or the shadow. The range of the candle is from the highest part of the wick to the lowest part of the wick.

We have to know that in the market, there are always two (2) forces in contention. They are the bull and the bear.
When the price of an instrument is going up, then the bull is having upper hand in the market and we say the market is bullish. Also, when the price of an instrument is going down, the the bear is having upper hand and we say the market is bearish.
In the same way, we have two types of candles which are the Bull Candle and the Bear Candle. When the market is bullish, it is represented with the bull candle which is usually colur green or white and when the market is bearish, it is represented with the bear candle which is usually red or black.

Considering the body sizes of the candlesticks, we have long candlestick which is also called strong candlestick and we have short candlestick which is also called weak candlestick.

Also consider the Candlestick shadows (tails) we have;
- Long Upper Shadow which implies that sellers rejected price at higher values
- Long Lower Shadow which implies that the buyers rejected price at lower values.

TO BE CONTINUED...