Photography # graph
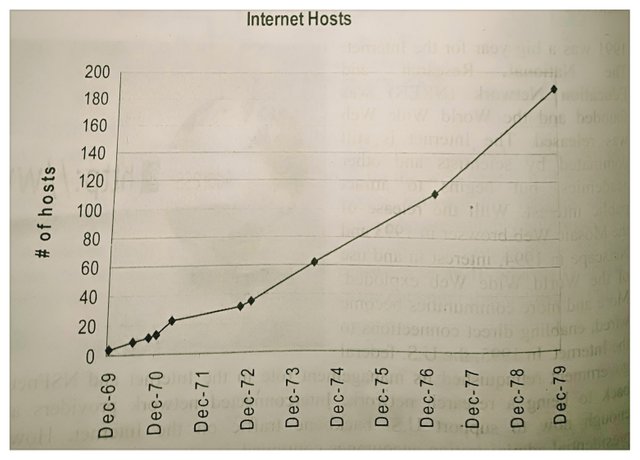
I'm going to presentation a graph this graph are related with internet user or internet used year.
I want to gave clear a message we counting 2 elements in this graph 1. Using year 2.user
The vertical method raw are Dce-69 using year & other horizantal method raw are user .
We can see that the using year increase with user & the curve are arising combination Between using year & user increase