Steem Blockchain Transactions - Heatmap
There was a reason for me playing around with some steem python functions.
Steem Blockchain Transactions
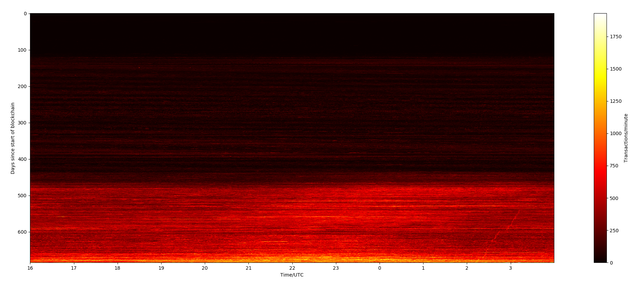
I looked into every block of the current blockchain and counted all transactions.
After counting, I did draw them on a graph.
Every block gets one pixel.
This would have been one long line. 19 Million pixels long.
So, instead, every day gets one line.
And to be more visible, we sum up one minute at a time. Now one pixel equals one minute.
Also, because the blockhcain was started at 16:00 UTC (+/- some minutes, that doesn't matter here), we need to calculate some fancy offset, to make the scale more approachable.
Et voilà:
Nothing much happened until day 480.
boom
reddit discovered steem.
Also interesting:
Every day between 2 and 3 UTC there seems to be something shifting, wandering down.. some peak of transactions..
Open it in a new tab, to get all details: 
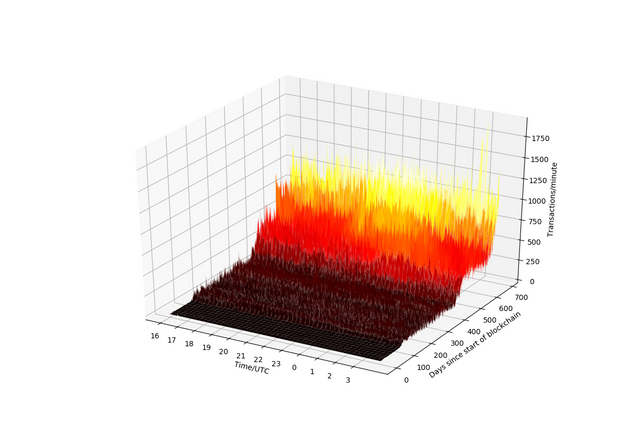
And to confuse you, here is a 3D plot:
This doesn't add anything at all.
But it looks like the flag of Germany.
Hurra!
And now.. questions?
Or ignore me;)
How did I get this data?
https://www.steemsql.com
Size of data: 45MB


creative and well researched keep it up, i wanna see more posts like that, keep sharing
This post has been upvoted by @microbot with 14.2%!
Vote for my creator @isnochys as witness!