Looking at a graph for the first time...(Learn To Earn Money With ''trading'')
This post is for all those who are not used to see and understand charts on the Stock Exchange.
In five minutes you will understand forever how this works. You will see that it is very simple.
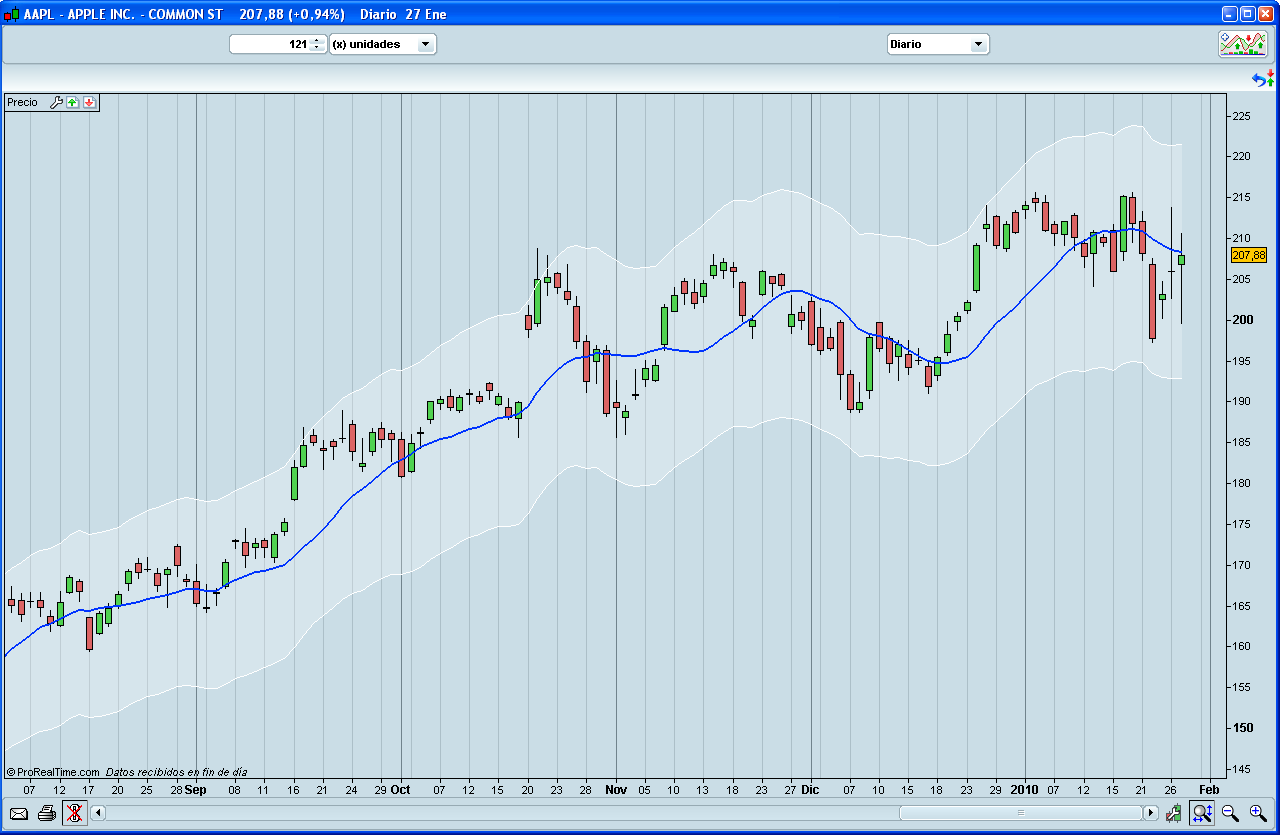
In the following image, we can see that in this example we have the graphic of Apple, the famous company of the iPod and Mac computers.
In addition, marked with a red circle (top in the center), we see that it is a daily chart. This is what is called a chart of Japanese candles, so each candle represents a day. There are charts in which the candles represent weeks or minutes, but this is daily.
The market every day, opens in the morning, oscillates throughout the day, down to a minimum, rising to a maximum and closes in the afternoon.
So, the highest point of each candle is the maximum price that Apple reached that day, the lowest point is the minimum price of the day and the body of the candle (in red or green, although they could be other colors). the space between the opening and closing of the market. If it is green, the price has risen between when the market opened and closed. If it is red, it is that the price went down:

Is everything clear at the moment? If you have any questions, leave it in the comments that I will answer.
In many occasions, the price charts are added lines and more graphics to quickly see the market situation. It seems complicated but it is extremely simple.
The first thing you usually do is add a moving average (the blue line) to determine at a glance which is the trend. We see, for example, that in recent days the trend is bearish. Although looking only at the last candles we do not have it very clear, the moving average reveals it easily:

The next thing that is usually done is to mark an enveloping channel or bollingers bands (in white), which lately is moving Apple's price. If we are going to buy or sell, this is very useful, because it warns you about the margin that the price is not likely to come out in the next few days:
In many occasions, the price graph is accompanied by a volume chart (practically always in the form of bars), which reveals the interest that people are having in Apple, as it counts the amount of sales that have been made during the day:

From here, the graph can be added some "extras", which are the technical indicators. There are hundreds, but we are going to show two of the most common, which are tremendously useful.
This one that we see in the next image, that of the green and red bars, is called MACD and reveals the strength that the bulls or the bears bring. When the bars are green it means that the bulls are stronger and that the price tends to rise, especially when the bars are getting longer. When they are losing strength, and the green bars are shortened, MACD warns us that the price will go down.
If the bars are red, the bears are stronger and the price goes down, especially if the bars are getting longer and longer. When they begin to shorten it means that the bulls are regaining control and that the price will rise:

This other indicator is the %R Williams. It is an oscillator and there are many similar to this. These indicators are fantastic to find the best time to buy and sell. They warn when people have been buying or selling and it is time to do the opposite. They help you buy cheap and sell expensive:

There are many more indicators and graphics can be added many accessories, but what we have seen is the most important.
Reasonably, with what you learned in this article, you will be prepared to understand almost any price chart you find out there and, in addition, you can analyze if it is a good time to buy or sell. Faster and simpler you can not!
Be sure to ask me any questions you have. Do not stay quiet and write a comment!
If you think this publication is useful, then give your vote. I'll be uploading more post of this type (Learn To Earn Money With ''trading'').