Spiking Corn Prices and Tornadoes Follow Low Solar Activity
This video was originally published 31/5/2019
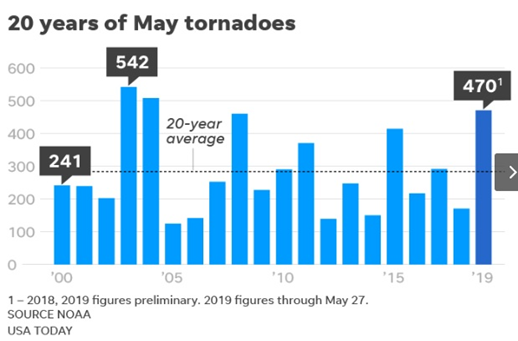
Spate of tornadoes devastated the United States. I hope people in those areas are safe, and I wish them the best in rebuilding. The news media, however, has hijacked this event to try to prove ‘global warming’, which they changed to ‘Climate Change’, and now relabeled as ‘climate extremes’. They are still forcing you to believe that these tornadoes are caused by CO2, but when we look back in 2003, there were more tornadoes than this current outbreak.
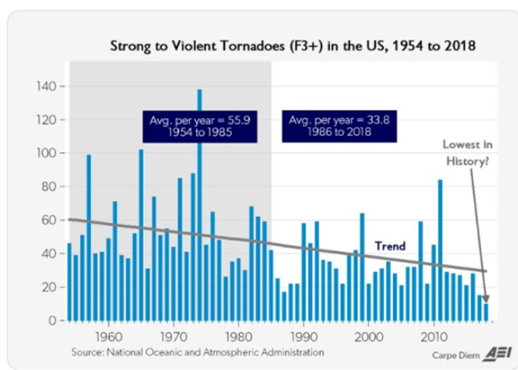
Even NOAA’s data from 1954 to 2018 revealed that several year’s prior, more devastating tornadoes occurred.
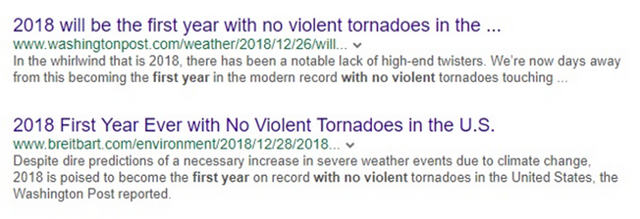
I do not understand this whole thing being caused by CO2, and that this is runaway Climate Change, because 2018 was the first year with no violent tornadoes. So, if it is supposed to be a build-up of getting warmer and warmer and more extreme climate, we should have been off-the-hook extreme in 2018, but this was not the case, rather, it was placid. Now corporate media is telling us now that Climate Change causes ‘no tornadoes’, as well as it causes tornadoes? The reality is all being hijacked for political purposes, as usual.
Now, while Dr. Roy Spencer explained why there are so many tornadoes this year, AOC and Bernie Sanders settled that this is due to Climate Change, but you have to understand, tornadoes require strong wind shear, and this condition exists when cold air masses slam against warm air masses.
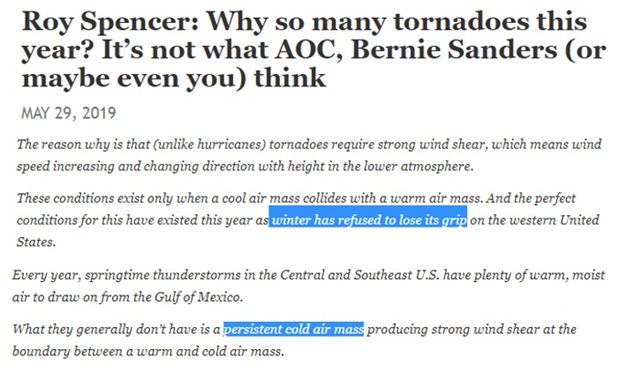
Since winter has refused to let its grip go in the western United States; that it was even snowing yesterday in Montana and Arizona, with all-time record cold and snow in parts of Colorado; another persistent cold air mass was created, producing the strong wind shear at the boundaries between warm and the cold.
As we move deeper into this Grand Solar Minimum and the wandering magnetic poles on our planet continue to accelerate, things are going to get very strange. The intensity ramp-up will be natural, but then, they are going to try to hijack the information, and say it is caused by CO2.
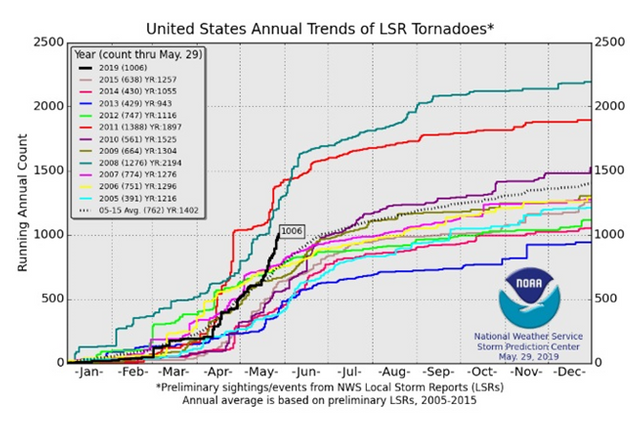
Look at these annual trends of violent tornadoes from EF 3 to EF 5, the top two lines in the chart below are in 2008 and in 2011. Again, if this instant increase was due to Climate Change, the trend should not be like that.
It should be a linear step-up, because CO2 is increasing each year. There should be more intense storms, but as you can obviously see, that is not the case.
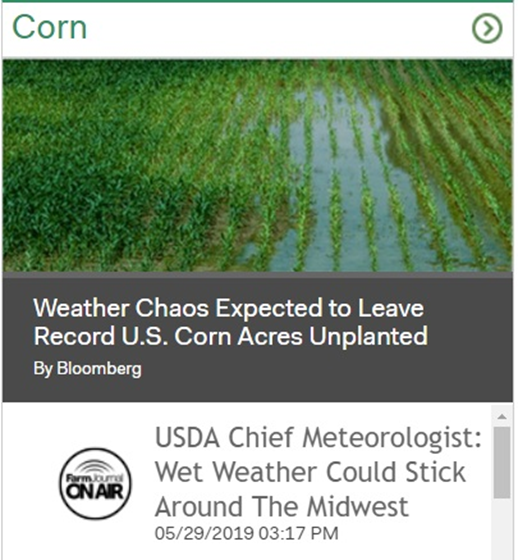
The situation that nobody is talking about is, this chaos is expected to leave record corn deficits and unplanted acreage, which is going to make not only corn prices, but food prices as a whole, to skyrocket.
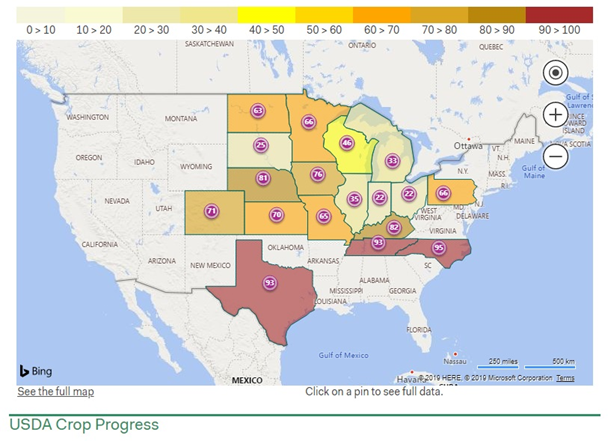
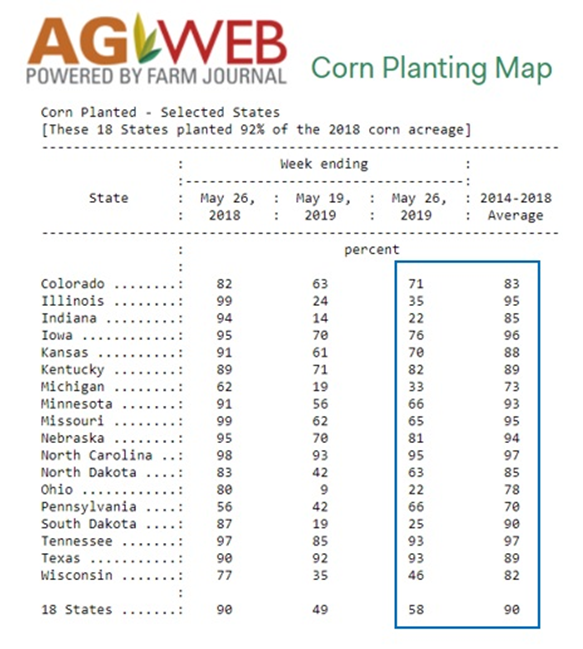
Look at the progress of corn planting as shown in this chart. Nebraska is at 25%, Ohio at 22%, Indiana is at 22%, and Iowa is dismal as well this year, compared to the national averages.
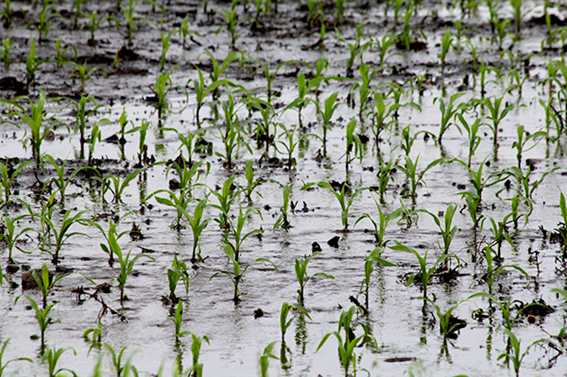
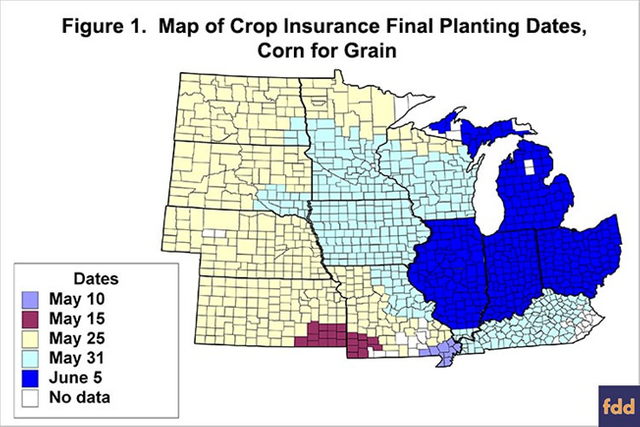
In addition, we are marching right past all the final planting dates before the farmers can claim federal crop insurance for ‘Prevent Plant’. They have no other means, but to go into ‘wet planting’ in order to get this insurance.
Farmers have to make an effort to try to plant those fields. They know that any type of crop it is not going to germinate, yet they will still plant.
The USDA will account that as planted acreage, even with the full knowledge that zero or incredibly dismal yield is forthcoming. We get to see what the yield estimates are around late August, but as we approach September, our food prices are going to skyrocket. Look closely at the corn planting map from AGWEB shown below, so you can follow with my analysis.
Numerical data from May 26, 2019 is also shown from AGWEB. Over on the right are the comparative averages. Keep in mind, they are ‘wet planting’, which means they will put seeds in standing water in the fields, just to claim the crop insurance.
It has nothing to do about having high hopes of any yields coming out, it is just about getting your machine on the field, so you can get paid from the government for your attempt to plant.
These then, are fictitious numbers. They are real in terms of acreage planted, but in terms of actual yield coming out or expected yields, those are smoke and mirror shows.
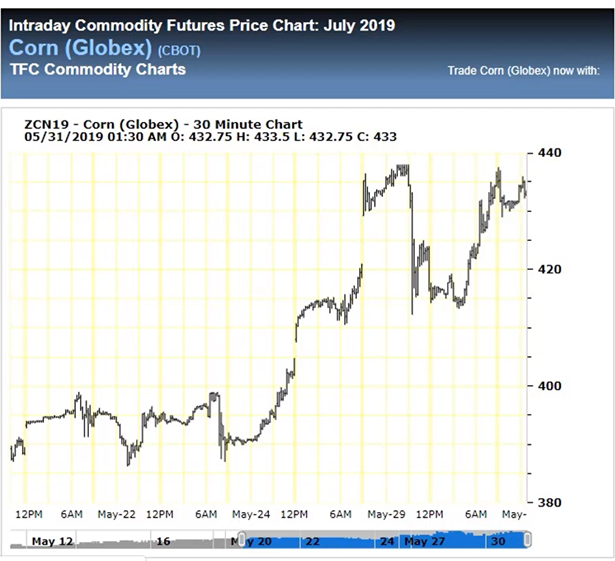
Look at Intraday Commodity Futures Price Chart for corn, going back to May 12th. What do you think will it be like when they will realize that there will be very little yield coming out of the United States this year?
China is just as dismal in shape, for their corn. They are out scrounging around the globe right now for access agriculture delievries, and they took full delivery just today. They are trickling along, trying to play the trade-tariff game, but they took full delivery on a full shipment, because they are not planting either.
Take note, almost 60% of the corn on this Earth is produced by these two nations that are both in dire straits in terms of crop production in 2019.
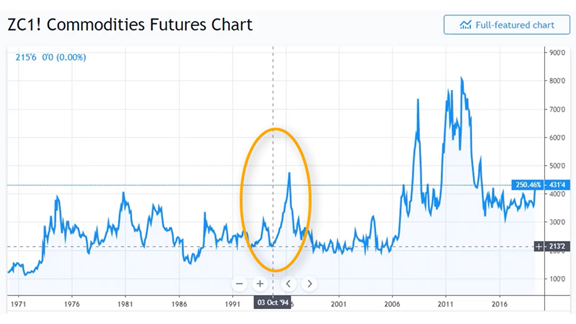
Now, if you do not think the prices are going to rise and everything is going to go right along with it, take a look at 1994, when massive floods occurred in the Midwest. I circled that in orange in the chart below, which as you can see, was a vertical rise. Now, however, that is going to go higher because the losses are intertwined with Chinese losses.
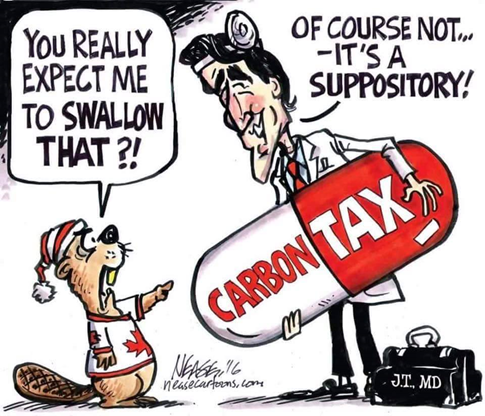
Somehow the corporate media will spin that it is all because of CO2, and try to sell you another carbon tax. You expect me to swallow that, nope, it’s a suppository!
Thanks for reading, I hope you got something out of the article. If you would like more content like this, I produce the tri-weekly Mini Ice Age Conversations podcast, 30 minutes of in-depth analysis on the GSM you can take on the go through out your day.
Mini Ice Age Conversations Podcast
iTunes: https://itunes.apple.com/us/podcast/adapt2030
Soundcloud https://soundcloud.com/adapt-2030
Libsyn http://adapt2030.libsyn.com/
(MIAC #212) First Grand Solar Minimum Global Food Shock is Here
http://adapt2030.libsyn.com/podcast/miac-212-first-grand-solar-minimum-global-food-shock-is-here

For the bi-weekly Grand Solar Minimum climate update newsletter from myself, David DuByne, (ADAPT 2030) jump over to oilseedcrops.org you can enter your email and sign up. Move your mouse around for about 10 seconds and this box will pop up.
Join ADAPT 2030 NEWSLETTER http://www.oilseedcrops.org
“Help support the adapt 2030 channel on brighteon so we can keep Grand Solar Minimum information free to access.”
https://www.brighteon.com/channel/adapt2030
Support ADAPT 2030 by Visiting Our Sponsors
ADAPT 2030 & My Patriot Supply 2-Week Food Supply with 92 servings
www.preparewithadapt2030.com
True Leaf Market Heirloom Seeds ADAPT 2030 True Leaf Market Link
ADAPT 2030 Amazon Grand Solar Minimum Book Store https://www.amazon.com/shop/adapt2030
Upheaval: Why Catastrophic Earthquakes Will Soon Strike the United States https://amzn.to/2E7KbBt
*** Today’s Story Links ***
Tornado warnings are meant to save lives. Why do some people roll their eyes?
A month of Mayhem: ‘Stuck’ weather pattern fuels hundreds of tornadoes
NOAA’s Misleading Tornado Graph
https://notalotofpeopleknowthat.wordpress.com/2016/03/11/noaas-misleading-tornado-graph/
NOAA graphs not updated since 2014 on Tornado page
https://www.ncdc.noaa.gov/climate-information/extreme-events/us-tornado-climatology/trends
https://www.ncdc.noaa.gov/climate-information/extreme-events/us-tornado-climatology
Number of tornadoes through May 29, 2019 vs average
https://www.ncdc.noaa.gov/climate-information/extreme-events/us-tornado-climatology
Strong Tornadoes Less Common In US Now
https://notalotofpeopleknowthat.wordpress.com/2018/10/23/strong-tornadoes-less-common-in-us-now/
Tornado track map https://www.spc.noaa.gov/wcm/#data
Another Quiet Year For Tornadoes
https://notalotofpeopleknowthat.wordpress.com/2016/11/12/another-quiet-year-for-tornadoes/
‘WHY SO MANY TORNADOES THIS YEAR?’ — BY ROY W. SPENCER, PH.D.
https://electroverse.net/why-so-many-tornadoes-this-year-by-roy-w-spencer-ph-d/
Corn planting map https://www.agweb.com/corn-planting-map/
Corn futures prices http://futures.tradingcharts.com/intraday/ZCN19#footerclose
*** ADAPT 2030 Social Media Links ***
PATREON https://www.patreon.com/adapt2030
YOUTUBE ADAPT 2030 Mini Ice Age 2015–2035 Series on YouTube
BITCHUTE https://www.bitchute.com/hashtag/adapt2030/
BRIGHTEON https://www.brighteon.com/channel/adapt2030
STEEM https://steemit.com/@adapt2030
MINDS https://minds.com/ADAPT2030
MEDIUM https://medium.com/@globalcooling
FB https://www.facebook.com/Miniiceage
TWITTER https://twitter.com/adapt2030
Some friends got some corn. It was small and had worms. Farmer said they could not spray because of the rain.
Glad I have some corn thriving in my back yard.
Posted using Partiko Android