Should We Believe Experts when They Say Sulfur Dioxide from Kilauea is Not a Global Threat
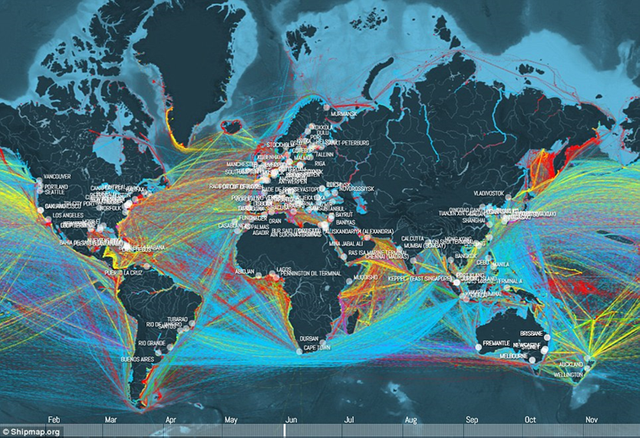
Good afternoon everyone, something strange and unusual is beginning to happen in the atmosphere, a continuous sulfur dioxide emission from Hawaii is now drifting over to Asia, no abatement in sight.
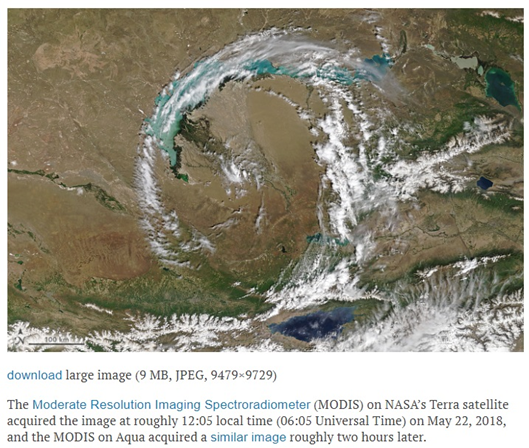
A look at some strange circular cloud patterns here off the Modi’s aqua satellite. This has nothing to do with what you’re seeing in the sulfur dioxide but none the less unusual cloud formation.
I bring it to your attention, because in 535 ad there was a series of eruptions. and when this sulfur dioxide pervaded the Earth’s atmosphere the albedo from the clouds increased, decreasing crop yields, and then people became increasingly sick because they had difficulty breathing SO2 laden air.
Now we’re supposed to believe the experts when they say, this sulfur dioxide is not a problem, go back to work don’t even think about it. So, I’m asking the question to you right now, should we continue to believe these experts?
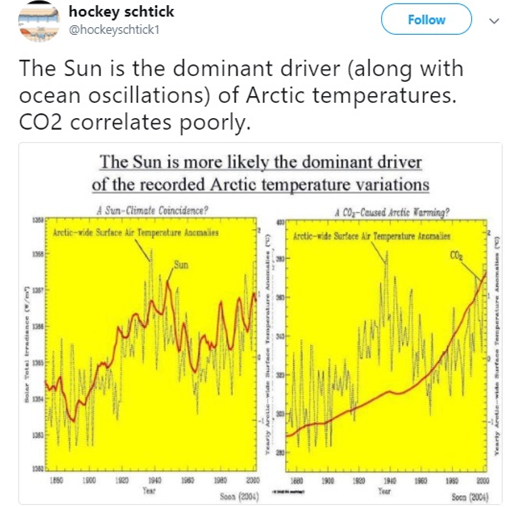
Let’s take a look at their track record so far, they’ve told us everything’s all based on carbon dioxide (CO2) and increasing temperatures, but when we look at the actual oscillations in temperature, it’s more like the Sun drives our climate then CO2 does.

This temperature chart starts in 1880. The global warming proponents love to grab that (1979 to current data) which is over on the right side, so it shows the trend that they’re looking for. You can disappear the Dust Bowl in the warmer than average temperatures the 1930’s, and you can also dismiss the cooling trend that went through WorldWar2 up into the 1960’s.
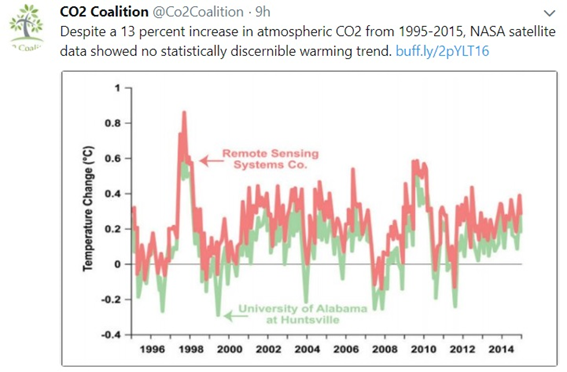
What I mean is there’s now conjecture even though there was a 13% increase in atmospheric CO2 from 1995 to 2015, temperatures did not rise this is what they call “The Pause”.
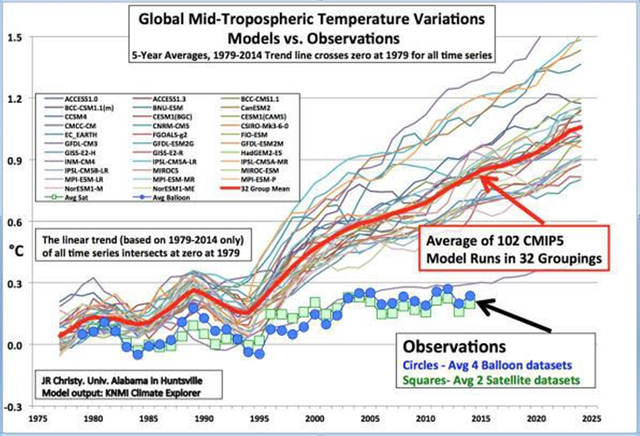
All the global warming models that we’ve always heard of forecasting two, three, four-degree temperature rise Celsius by the end of the century isn’t happing. Bottom blue is the observed, where we actually are, and this is pretty correct because we’re at 0.22C above baseline. All the models running or putting it at 0.09, 1.2℃ even the higher temperatures at 1.5℃ by 2025 they’re not even anywhere close.
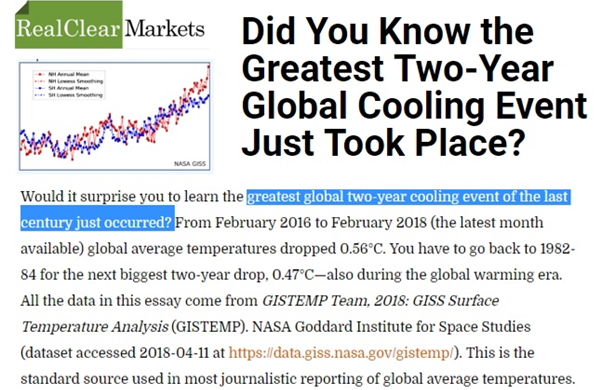
The new reports out just this week, did you know the greatest to year global cooling event just took place? Unless you’re in this world following this type of news, because the media did not report on this. You have to understand the temperature drop that just occurred in the last two years. We have to go back to 1982 to find something similar with the trend. And dropping temperatures doesn’t make sense either, I thought it was supposed to warm into infinity.
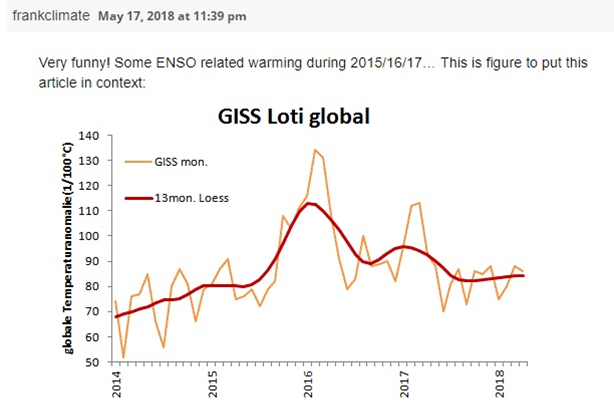
Taking a look at the temperatures here, showing you a small glimpse 2014 to 2018. This is just a four year window.
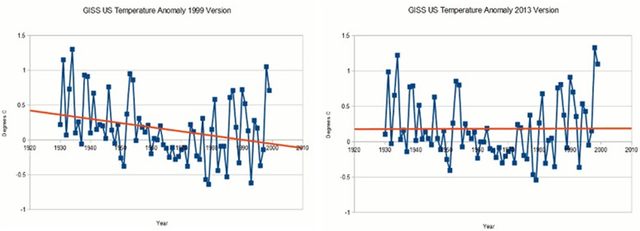
When the media and scientists from the IPCC talk about GISS temperatures, you should know that NASA and NOAA both have been manipulating these temperatures for quite some time. A side-by-side comparison of prior to and after changed smoothed averages.
A bit greater detail here also going over to the NOAA site, again, you must to look at these NOAA temperatures and start to think how accurate they are. They do reflect that drop-in temperature, the steepest drop since we’ve seen back to the 1980’s. so I guess they couldn’t mask it that much.

(Above) Dr. Roy Spencer’s site, lower troposphere temperatures, those last temperatures I show you where the land + sea, but you have to realize there are very few ocean buoys out there to measure the total sea area as well as continentally. How many temperature stations are measuring every even 10 square kilometers, even ten square miles of our planet? Once you leave the United States and Europe, areas just aren’t covered except by satellite, especially down in Antarctica, they only have 208 temperature stations for an entire continent. Telling you again and again that it is warming down there to infinity. How can you possibly say that when there’s only 208 temperature stations to cover an entire continent at least as large as the United States. We see the same drop again and we’re talking about baseline temperatures 0.21.
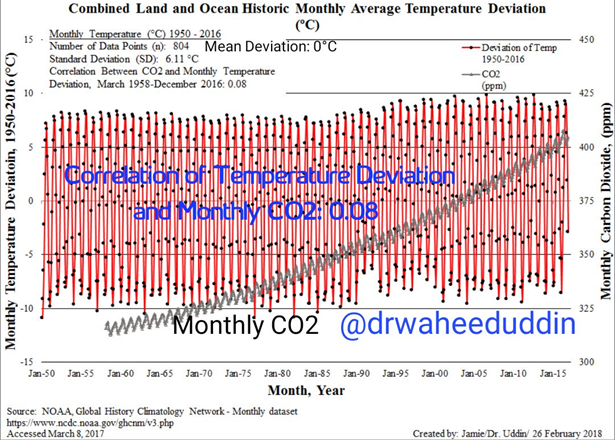
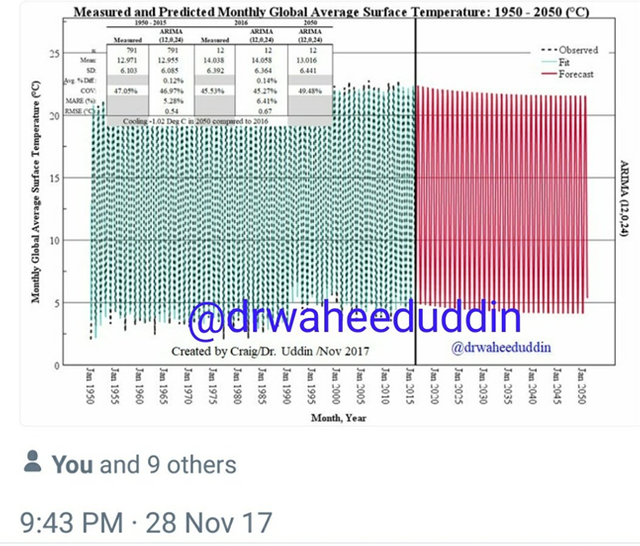
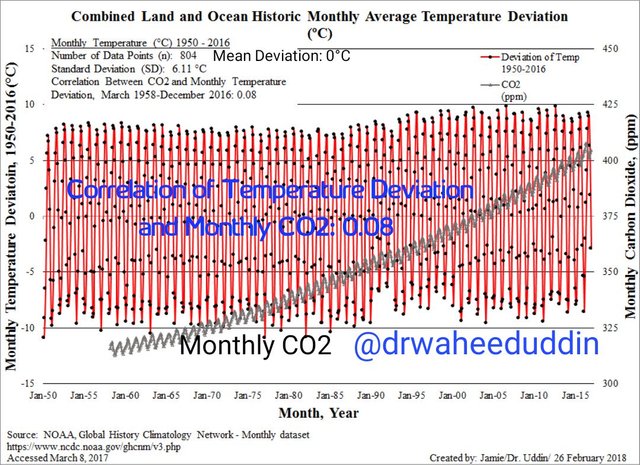
Dr. Waheed Uddin, as well, overlaying and correlating rises in CO2 from Mauna Loa with global temperatures, taking you clear back to 1955. Do you see your runaway temperatures?
Global warming is not real!
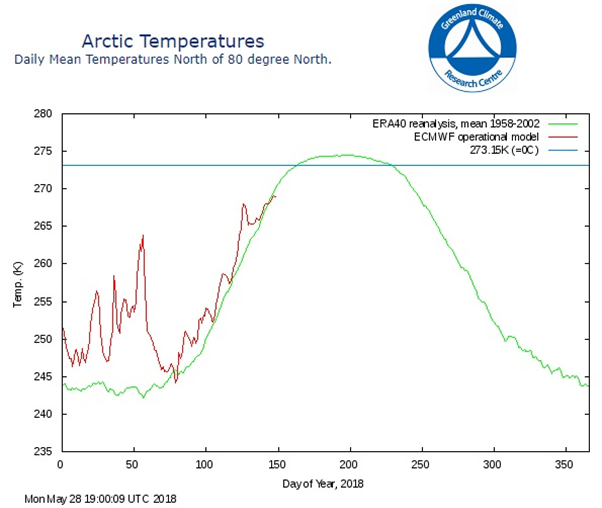
They’re trying to scare you into a global tax. Let’s look at some more numbers I was told over these last couple weeks, that the Arctic is melting, it’s a heat wave! Arctic temperatures are that red line, that is the current temperature, the Green Line is the 1958 to 2002 mean average. Look at that red line, it’s actually a little bit below average temperatures. The top of our planet literally from eighty degrees north to ninety degrees at the very North Pole, is a little bit below normal temperature. But the media is telling you it’s above normal and I just don’t get it.
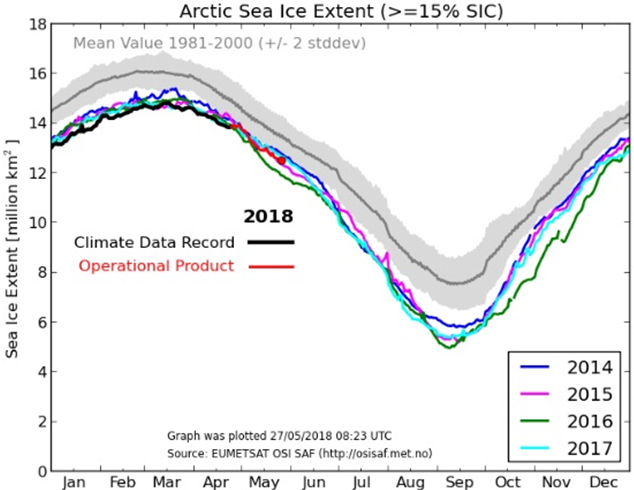
They keep going on and on about the Arctic sea ice. The red dot is the working model, where it’s the operational project, a little bit ahead of what’s been recorded. When we’re looking at smaller timeframes, you see that something has just switched into cooling. Why is there more sea ice now than there was in 2014 and 2015? They keep trying to bring it back to something like you can only compare from 1970s forward, not smaller 5 year trends.There has definitely been a shift.
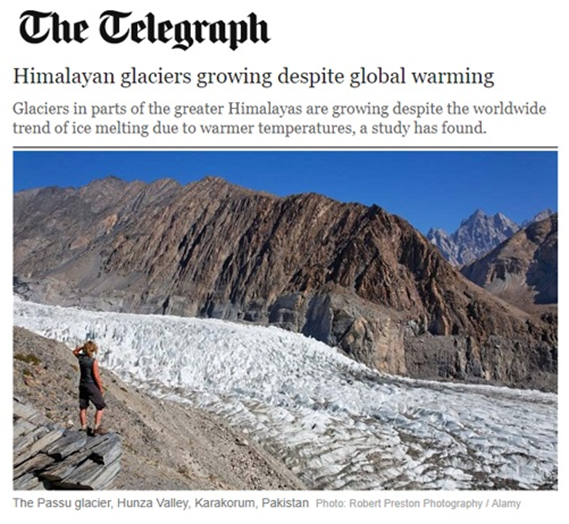
Himalayan glaciers are growing now, despite global warming. Right off the Telegraph, great article I’ve linked everything in the description box below so you can chase down all these articles yourself.
You got glaciers growing again, snowpack whether it be Europe, United States, and India.
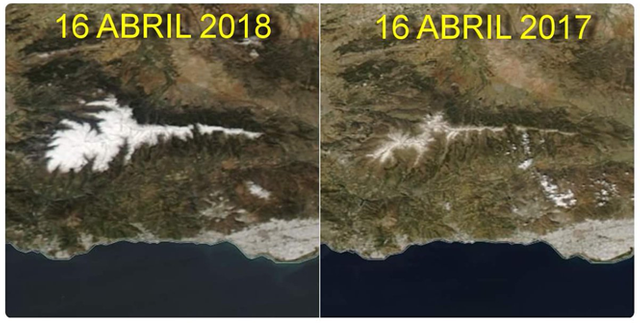
We keep seeing all of these sea level rise predictions across the United States and some places in Europe haven’t risen that much.
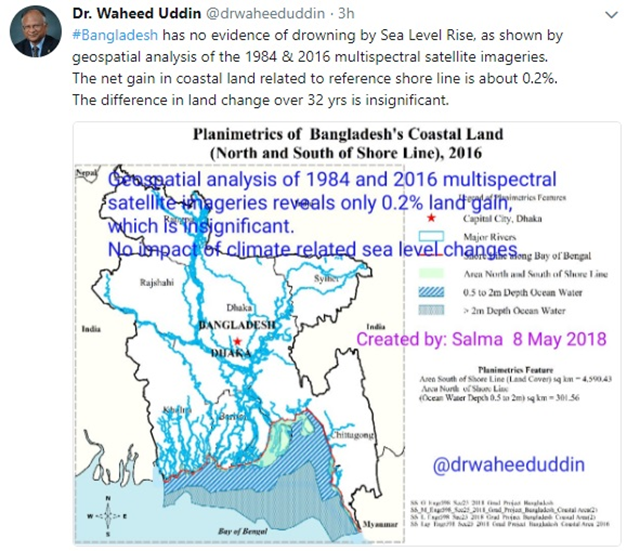
So, I thought let’s look somewhere else, Bangladesh. It was supposed to be the test case, because it was so lowland, it’s very gradual going up from sea level, so anything there would be affected first. Dr. Waheed Uddin this is May 8th of this year, absolutely stating there’s no impact of climate related sea level changes. How was this possible you’ve been told again and again that sea levels are rising? Yet, another body of researchers is coming out now saying from 1984 to 2016 multi-spectral satellite imagery, saying no climate change related sea level rises. Everything is starting to fall apart.
David Birch, I appreciate you putting this out here with the mainstream media storm intensity, not intensifying. and David Dilly said the exact same thing these are the numbers for you.
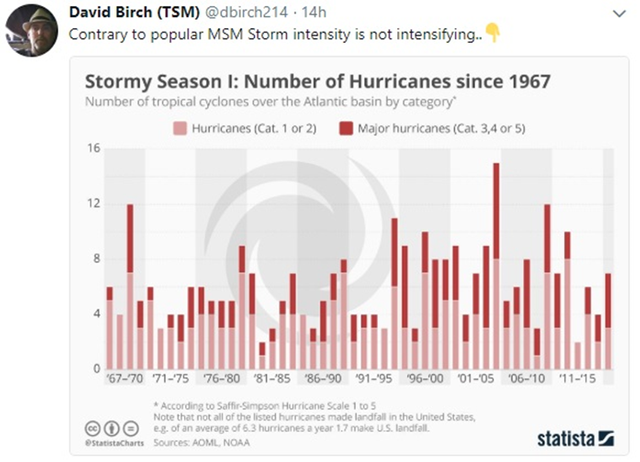
If storm intensity was increasing with CO2, you sure would not see a drop-off and then a peak, and then a drop-off and a peak and then a drop-off. It should have just been straight up like the CO2, as you see increasing to what four hundred and four parts per million. Earth has its own variability based on effects from our Sun and cycles and our Sun.
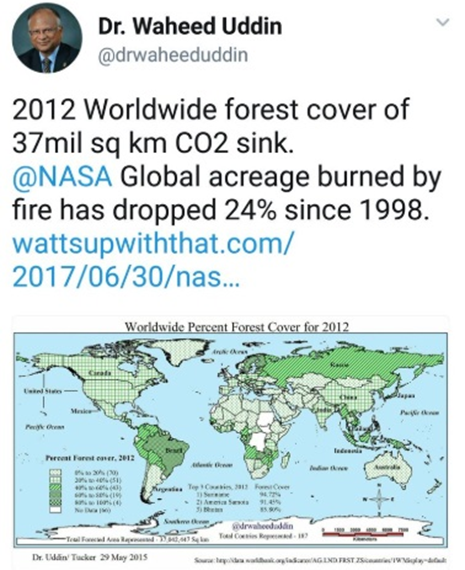
I’m also going to drop you back here from Dr. Waheed Uddin once more with a wattsupwiththat.com article. They’re talking about 2012 forest cover the global acreage burned by fire was down 24% since 1998. Let’s mark that in time.
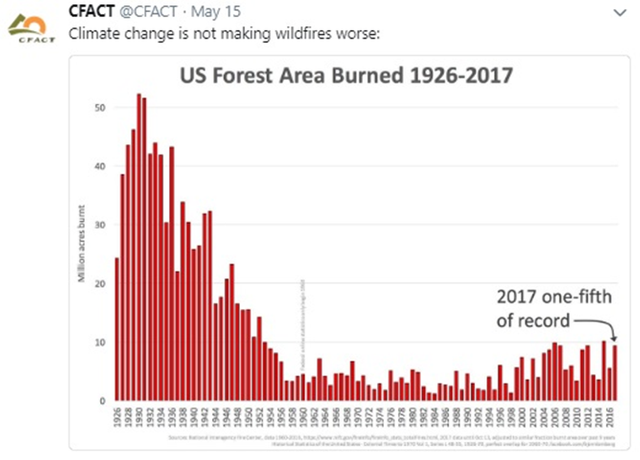
(Above) We’ve got these two dates and then I’m going to bring you right up here, 2017. Wait a second, it’s at or less those same exact numbers and this is the area burned from 1926 to 2017. Let’s go back into the Dust Bowl far left of the chart here. 1930, 1932, 1934, and 1936, noticed the amount of areas burned. They keep telling you in the media it’s all because of you, it’s because of CO2, you’re causing the forest fire intensity. We need to go in longer duration timeframes and take a look truly at what’s happening.
Forecasting out, declines in temperature. We are in the Grand Solar Minimum and I’m trying to show you that all of these forecasts and all this information you have been fed your entire life so far if you’re under 40 years old, even if you’re over 40 you started to hear it 40 years ago, that’s always our fault all these things are changing its CO2, it’s you it’s your driving the changes. I’m clearly showing you it is not, and everything we’re being fed is not a hundred percent truth.
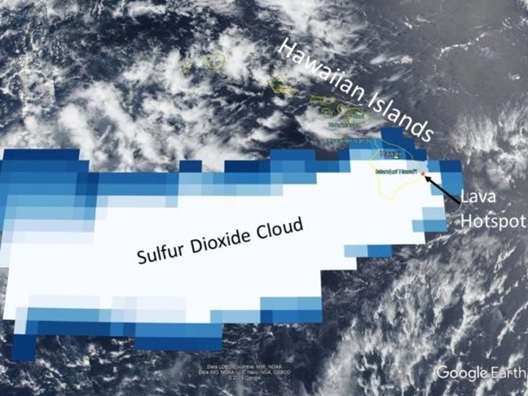
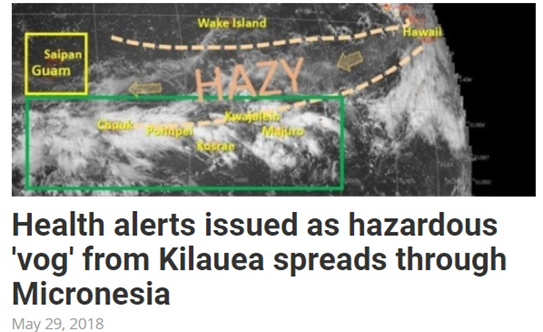
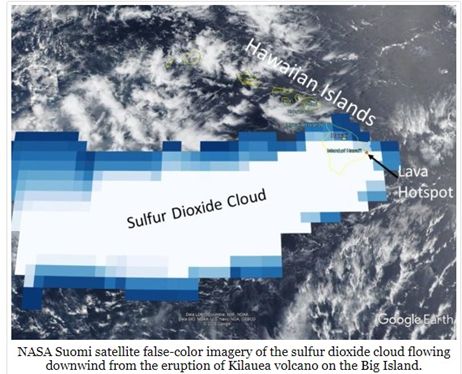
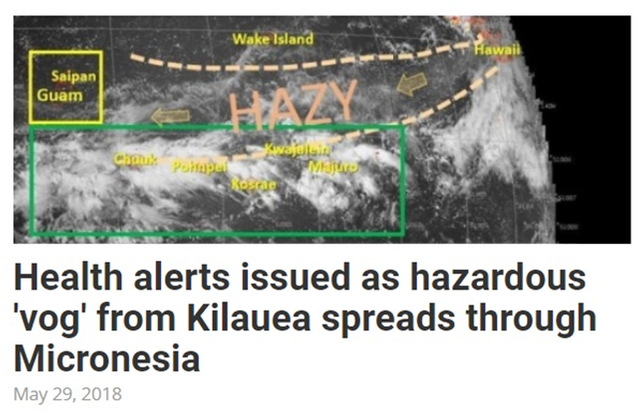
Health alerts issued as “hazardous vog” from Kilauea spreads over to Micronesia and then over to Asia. As the eruption continues, and it’s been going on since what the 1980’s and is now amplified due to the intensifying Grand Solar Minimum. What if this eruption does not abate? What if this continues for two or three or four years more at the intensity in Hawaii it is? This sulfur dioxide is going to completely envelop the Northern Hemisphere this is what happened in the Late Antique Little Ice Age (535 AD).
During the (LAIA 535AD) they talked about sulfur dioxide poisoning people trying to breathe, they had respiratory issues and the reflectivity of the clouds created conditions for bad agriculture and lost crops due to sulfur dioxide. Researchers pinned it down to two major eruptions. So, let’s think of Kilauea is the first continuous sulfur dioxide smokestack from our planet.

We already added a bunch of stuff up there with pollution in our own right. Not CO2, forget about that, we’re talking about particulate, how much col we burn, how much pollution is there from ships traveling around our oceans, how much pollution is up there from all these jet aircraft zooming around the planet. Yeah, we made an effect on the planet, we sure did, we polluted it with particulates. CO2 is a different animal, that’s a gas not a solid.
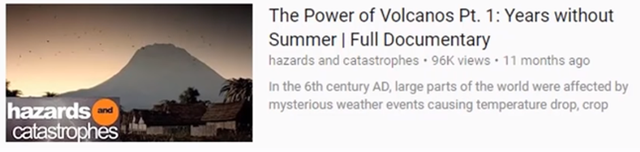
You definitely need to watch this video the power of volcanoes part 1 “Years without a summer”, and after you watch what happened in the 6th century AD. about the effects in Constantinople. The effects across Europe, the effects across North America, and Asia during this time with the effects of sulfur dioxide from three separate larger eruptions.
What we have in Hawaii is a continuous eruption, a continuous bellowing up into our atmosphere. We’re supposed to believe the experts that there’s nothing to worry about, don’t think about it, just go back to work watch a TV. It’s all good, believe us we’re the experts. Yet, I’m looking at these same experts going wait you just gave us bad information, after bad information of forecast after forecast that have never come to fruition. Especially that bad call by Al Gore saying “snow would be a thing of the past” and “your children will never know what snow is”. The Northern Hemisphere just had one of the snowiest winters in the last 40 years.
My odds are now on the historian’s, the astrophysicists and the scientists that are saying Grand Solar Minimum Cooling is here, intensification is here.
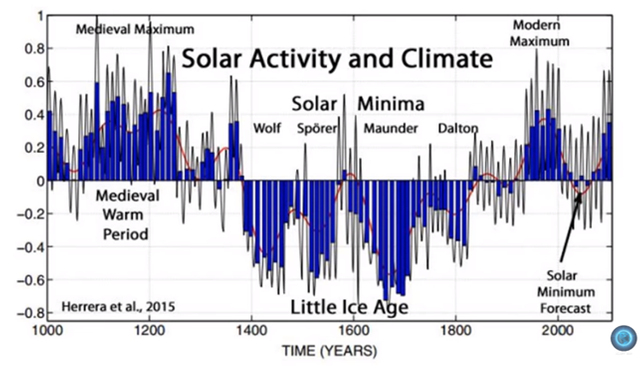
Look into a history book and see what happened before because it’s a cycle. It’s been a cycle for hundreds of thousands of years, and we are repeating again.
I really encourage you to watch that YouTube video about the “year’s” plural without a summer. You can see how sulfur dioxide (SO2) affected societies at the time and took down empires. What’s going to happen if this eruption does not stop over the next couple years in Hawaii?
Links to all of the articles in the video
ADAPT 2030 Mini Ice Age 2015–2035 Series on YouTube
https://www.youtube.com/user/MyanmarLiving
Should we listen to experts when they say SO2 is harmless
Himalayan glaciers growing despite global warming https://www.telegraph.co.uk/news/earth/environment/globalwarming/9206785/Himalayan-glaciers-growing-despite-global-warming.html
Don’t Tell Anyone, But We Just Had Two Years Of Record-Breaking Global Cooling https://wattsupwiththat.com/2018/05/17/dont-tell-anyone-but-we-just-had-two-years-of-record-breaking-global-cooling/
IPCC Climate models http://elonionbloggle.blogspot.tw/
GISS Temperature data manipulation 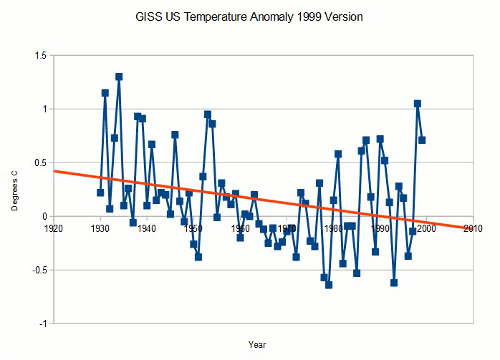
Strange Clouds https://wattsupwiththat.com/2018/05/28/nasa-satellite-captures-photo-of-bizarre-circle-of-clouds/
Arctic temperatures http://ocean.dmi.dk/arctic/meant80n.uk.php
Did You Know the Greatest Two-Year Global Cooling Event Just Took Place? https://www.realclearmarkets.com/articles/2018/04/24/did_you_know_the_greatest_two-year_global_cooling_event_just_took_place_103243.html
https://data.giss.nasa.gov/gistemp/graphs/
The Version 6.0 global average lower tropospheric temperature (LT) anomaly for April, 2018 was +0.21 deg. C, down a little from the March value of +0.24 deg. C The Version 6.0 global average lower tropospheric temperature (LT) anomaly for April, 2018 was +0.21 deg. C, down a little from the March value of +0.24 deg. C: 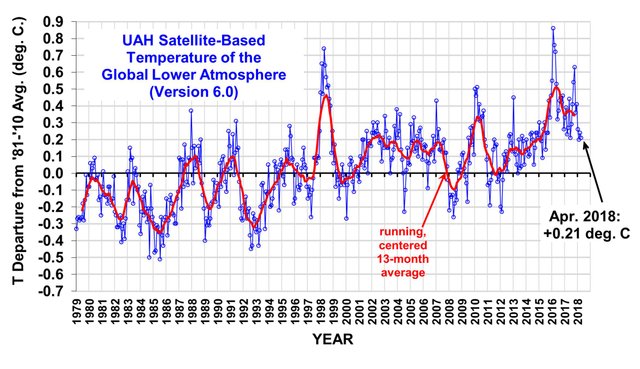
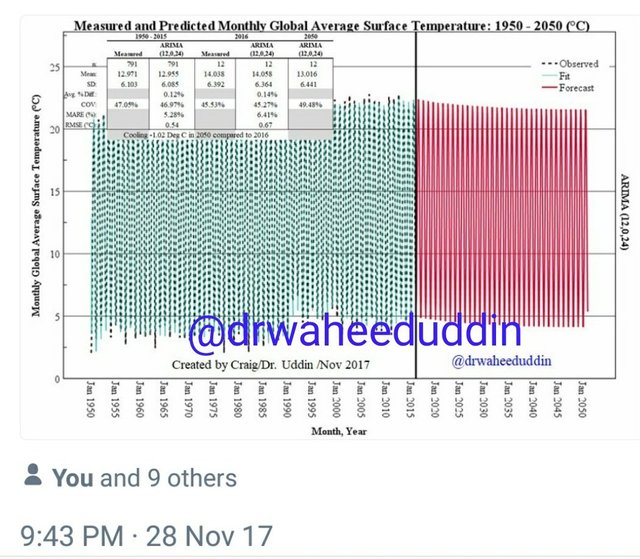
Dr Waheeduddin Temperature forecast to 2050
Hawaii SO2 drifting across the Pacific https://watchers.news/2018/05/29/health-alerts-issued-as-hazardous-vog-from-kilauea-spreads-through-micronesia/
very good post And what he says is something alarming and that everyone should pay attention.