Global Wheat Yield Down What’s Next? Grand Solar Minimum Grain Report

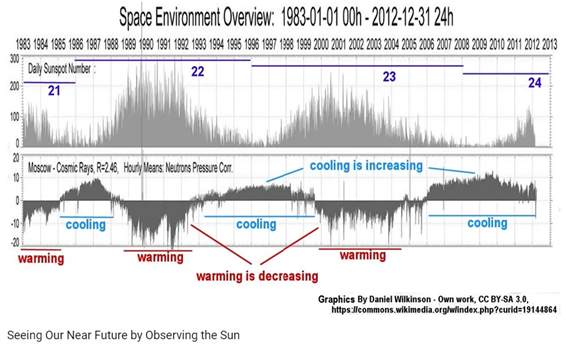
In my playlist, you’ll find an interview that I did last year with Rolf Witzsche and Trevor from Suspicious Observers in a roundtable. Rolf was also predicting crop losses, declines in solar activity based on what’s going on with the magnetic fields of our Sun and diminishing solar wind. This was what he pointed out in part four of his Ice Age Science Recapitulation Series: Seeing Our Near Future by Observing the Sun.


I watched the entire video and he explained very well that the daily sunspot number is overlaid with cosmic rays and that we’re going to be seeing a lot of changes in cloud cover and jet stream movement. If you want to get a glimpse in crystal ball going out in five years, check out that video.
The main crux coming into the harvest season are so many things you’re seeing in the corporate media, they say it’s a bumper harvest, yet yields are down 20%. We’re getting mixed reports at the same time. I think this is done on purpose to confuse people. So I really wanted to delve into the facts, because I get a lot of comments on board in both directions, on what’s going on in the yields in wheat and grains across the planet.
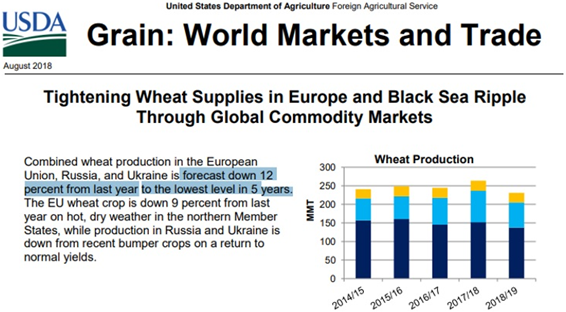
I’m going to start with wheat in this forecast, the focus will be on global grains. Tightening wheat supplies in Europe and Black Sea Ripple through the global commodity markets.
I’ve been saying that more sensitive crops such as oats, rye and wheat are going to be hit first as we go into the Grand Solar Minimum. They’re going to be diminishing in global yield by 10, 20, to 30%; while others such as soy and corn are going to have much greater yields further in. Wheat forecast are down 12% from last year for the E.U, the lowest in five years. This ripped apart Russian and Ukrainian bumper crops last year. If these two countries didn’t have bumper crops in 2017, this would have been down even further.
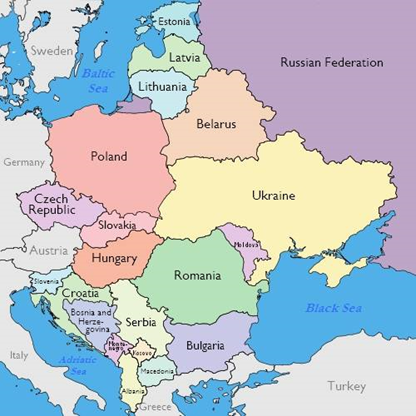
The map below shows some areas I’m going to focus on. The far left, right next to Germany are the colored countries, Czech Republic, Poland, Lithuania, Belarus and Ukraine.

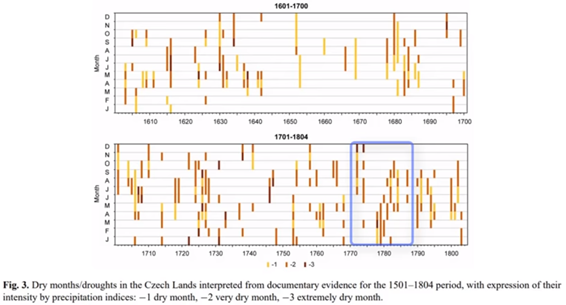
Czech Republic. I did a whole video series on this last year, about the drought stones! “When You See Me Cry.” Below a certain water level, there is extreme drought in those areas and before just-in-time (JIT) delivery, massive famines accompanied these droughts.
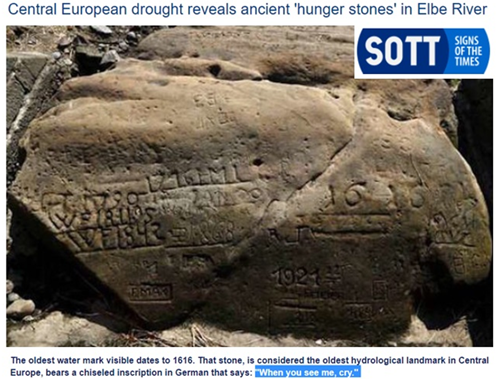
Czech Republic was called the Czech Lands, back in the 1600’s, it experienced massive droughts affecting the crops. Droughts don’t stop at borders, they move across borders, and looking back at droughts in the Czech lands, I had theorized that we’re going to be rolling back and repeating something in the 1780’s in terms of intensity. This is how long it’s going to last in the blue box. Visit the playlist to see the full analysis of the droughts in the Central Europe and in the Czech lands.
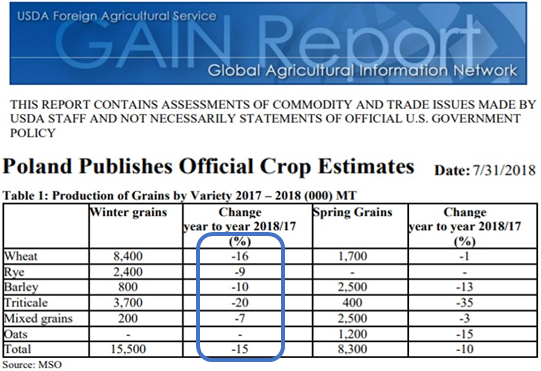
Right next to the border is Poland. Of course they’re going to be affected as well.
Poland published their official August crop estimates. Wheat, down by 16%, Rye, 9%, and Barley, 10%.
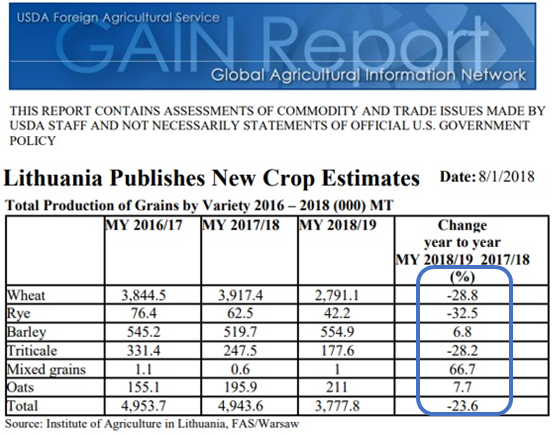
Moving along to Lithuania, the next country further north and to the east, the light blue country next to Poland in the map. The table below shows the production of winter grains. Note that total grains and winter grains are different. Those are massive drops of 39% on the far right. I circled it in blue for ease of finding. Those are substantial losses, Lithuania! 40% down, that is an enormous amount!
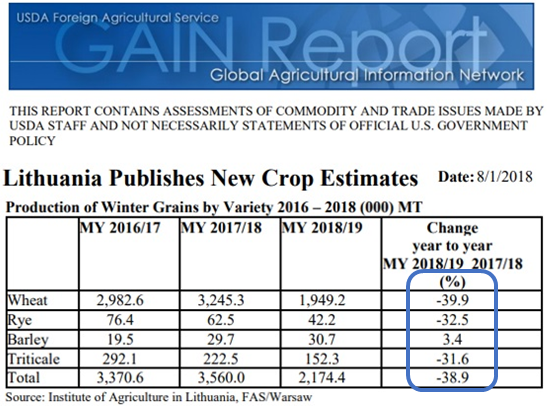
Look at the total production of grains in the entire year. Wheat was also down to a full 28% over the year. Winter grains then would be winter wheat, but the total for entire grains throughout the year, spring wheat etc., was still down by 28%. Rye, down by 32%, barley went up a little bit by 6.8% but still, it went down to a total of a full 23%.
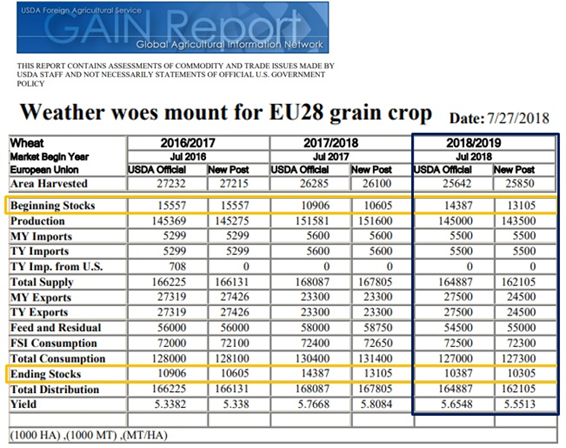
Weather woes mount for the European Union in grain crops. I put a couple different boxes with different colorations to make it easier to find. Moreover, when you go above a thousand million, it starts to get into such large numbers with all the zeros which is confusing. So you can see at the scale at bottom left. They’re talking about thousands of hectares and thousands and millions of metric tons etc. The yellow boxes then show the beginning and the ending stocks in millions of metric tons.
When we take a look at the beginning stocks, it went up at around 14.3 million metric tons in the beginning stocks, carryover. But, at ending stock, they’re looking at around, what, ten million? Then they’ve revised that, as it seems a little spooky when you’re going to be losing that much in terms of percentage so it was lowered to 13 million in the new post. Far at the right, the full blue box encapsulates this year. Anyway, I’ll let you do your own analysis with this one. Figure out what they’re trying to do to stabilize and so as not to spook markets or the population.
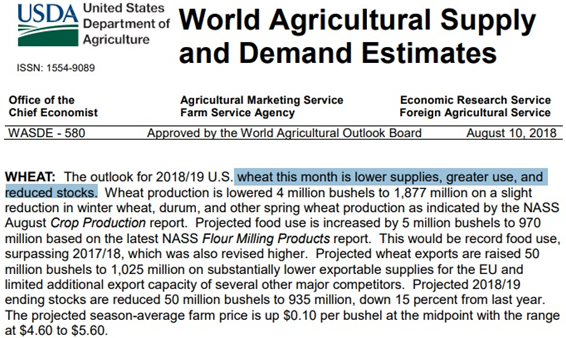
Moving on to the World Agricultural Supply Demand Estimates. This is on August 10th, it’s been a month already, but you know, they’re not giving any newer information in the USDA. Wheat this month lowers in terms of supplies due to greater use and reduced stocks, meaning, price up. They’re even saying in the very last paragraph that they’ve projected 2018–2019 ending stocks reducing by fifty million bushels, down by about 15% globally.
As you’re cruising through the charts, you’re also going to need to take into consideration that those were in millions of metric tons, that tonnage in America is different to that in Europe and that they’re talking about bushels with the different variances. So as you jump through, take a look at the weighted averages and prices so that you can get the forecasts as to where they’re losing grain yields and how much they’re losing.
Staying just in the U.S. Wheat by Class, above where it says beginning stocks 2017, in that first yellow bar. Notice that it is represented as millions of bushels. The beginning stocks for Hard Red Winter were at 589 million bushels, projected beginning stocks at 581 for 2018–19, but look how it drops to 417 at the bottom line.
These are projections. I understand, they’re projections on what’s going out in 2019 but I don’t think that they’re taking into consideration the intensification of this new Eddy Grand Solar Minimum. I think these numbers are way high in my own opinion! They’re incredibly high losses coming in for next year, because we haven’t come to the planting season yet. There’s the wipeout of the canola crop and other crops up in Canada of over $5 billion due to do unexpected freezes in the summer. If it repeats anything like the last late planting season, and we get more losses this harvest season, these numbers are going to be out the window! The Hard Red Spring, they’re predicting an increase as Soft Red Winter declines from 215 million bushels down to 169.
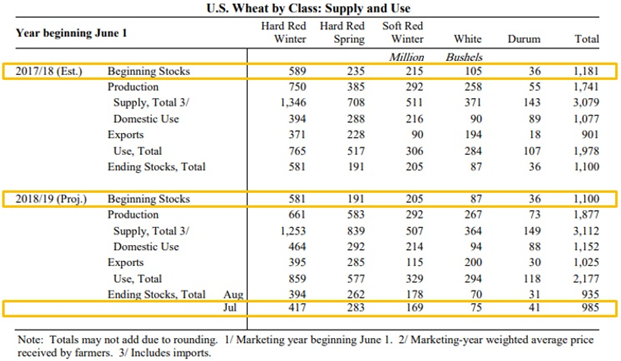
Here’s the thing, total Durum, White Wheat, Red Wheat etc. are calculated as everything altogether at 1,181, then it drops to 985. Even with the forecasts going out, everybody’s showing declines in the future. Regardless of the amount of the declines, they’re still all declines!
But in the corporate media they’re saying, “hey record harvest, we’re going to increase yield, we’re going to increase the area planted,” yet everything you look at shows decreases for next year. I will leave it to you to figure out the agenda behind that.
Take a look at the International Daily Freight onboard FOB Export Bids. Everything is up, I don’t care if you’re in Argentina, Australia, Black Sea, European Union, or U.S. All of it is up! Yet, they’re telling you in corporate media, “it’s a bumper harvest crop and prices are going to be stable, and it’s an awesome world we live in!” I’m going to say, take a look at how much wheat prices are increasing.
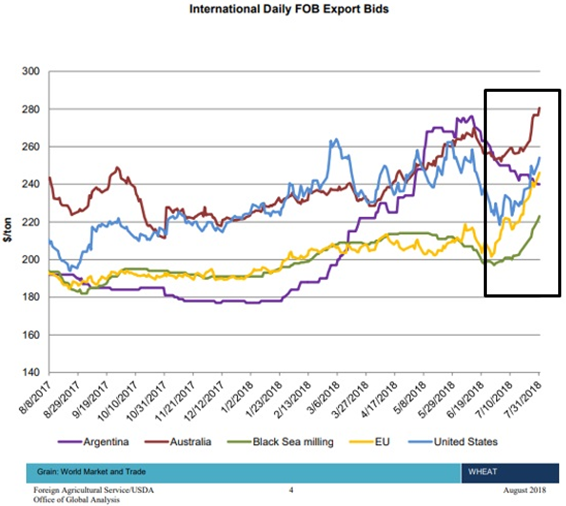
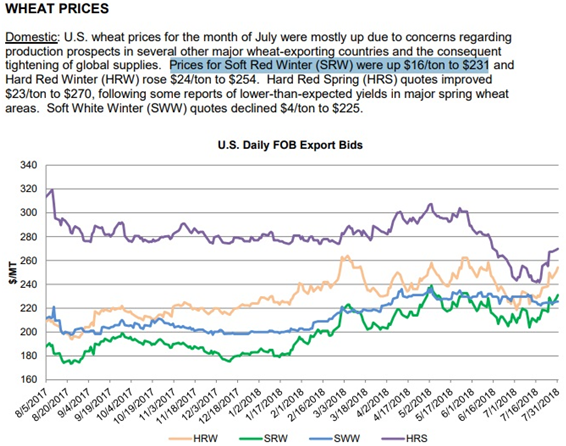
The Soft Red Winter is at $16 a ton, then we look at the Hard Red Winter Wheat, it’s up at from $24 a ton up to $254, that’s nearly ten percent increase! Those are staggering gains. Realize that in the commodities grains futures game, this is a staggering price increase. Usually it moves slightly, but not this much, this is a flag for sure. Red flag right here! Something is definitely going opposite the supply direction that push these prices.
In the corporate media, I’ll tell you right away, they are going to start focusing on corn and soy, because corn and soy are having bumper crops year. Culturally wheat is the staple, are you going to switch your diet suddenly to a 100% soy-based diet, and go away from anything wheat? I highly doubt it. That will be the same with all the substitution crops. If rice gets too expensive, do you think people who eat rice predominantly in their main course for the day are going to switch over to sorghum and start eating that? There’s going to be a lot of cultural issues with “daily bread” if you will.
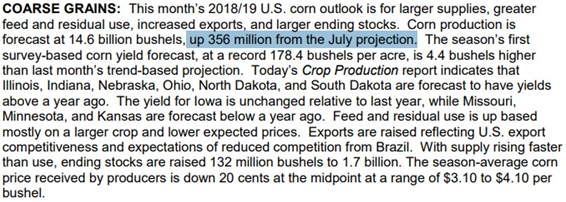
Also, corn production is up to 300 million bushels from last year and of course when production is up, prices goes down. Corporate media is going to keep focusing on these types of grains. They’re not going to touch the barley, the oats, the rye or the wheat. They’re going to exclusively focus in on corn and soy so global crop losses don’t spook the populace.
You can see how the narrative in corporate media is going to move as well to assure you that all the food price rises you’re experiencing aren’t because of declining yields. It’s got to be something else, could be a disease outbreak, trade war, whatever it is. They’re trying to have you look left when you should be looking right, to really see what’s going on.
Thank you so much for reading the post, I hope you got something out of it. If you like more information like this is a 30-minute podcast check out Mini Ice Age Conversations commentary to help you navigate through the reset button for our society.
Join ADAPT 2030 NEWSLETTER http://www.oilseedcrops.org
Mini Ice Age Conversations Podcast
iTunes: https://itunes.apple.com/us/podcast/a...
Soundcloud: https://soundcloud.com/adapt-2030
Libsyn: http://adapt2030.libsyn.com/
MIAC #122 Would you tell the population of the impending changes on Earth? http://adapt2030.libsyn.com/miac-122-...
ADAPT 2030 & My Patriot Supply: Taking the Fear Out of Difficult Situations 2-Week Food Supply: (1,500+ calories/day with 92 servings)
www.preparewithadapt2030.com
ADAPT 2030 Amazon Grand Solar Minimum Book Store
https://www.amazon.com/shop/adapt2030
*** Today’s Story Links ***
USDA Commodities Reports https://www.fas.usda.gov/commodities
http://usda.mannlib.cornell.edu/usda/...
USDA August Report https://apps.fas.usda.gov/psdonline/c...
https://www.fas.usda.gov/data/world-a...
Lithuania Publishes New Crop Estimates https://gain.fas.usda.gov/Recent%20GA...
Poland Publishes Official Crop Estimates https://gain.fas.usda.gov/Recent%20GA...
Oats analysis https://www.fas.usda.gov/commodities/...
Weather woes mount for EU28 grain crophttps://gain.fas.usda.gov/Recent%20GA...
Seeing Our Near Future by Observing the Sun New Rolf Witzsche Analysis
Piers Corbyn Interview Sunspot Prediction for Solar Cycle 25
http://adapt2030.libsyn.com/miac-101-...

*** ADAPT 2030 Social Media Links ***
1.) PATREON www.patreon.com/adapt2030
2.) BITCHUTE https://www.bitchute.com/hashtag/adapt2030/
3.) STEEM https://steemit.com/@adapt2030
4.) *** ADAPT 2030 True Leaf Market Link ***

5.) Mini Ice Age Conversations Podcast
Libsyn: http://adapt2030.libsyn.com/
iTunes: https://itunes.apple.com/us/podcast/adapt-2030-mini-ice-age-conversations/id1200142326
6.) FB https://www.facebook.com/Miniiceage
7.) TWITTER https://twitter.com/adapt2030
8.) YOUTUBE www.youtube.com/user/MyanmarLiving

9.) MEDIUM https://medium.com/@globalcooling