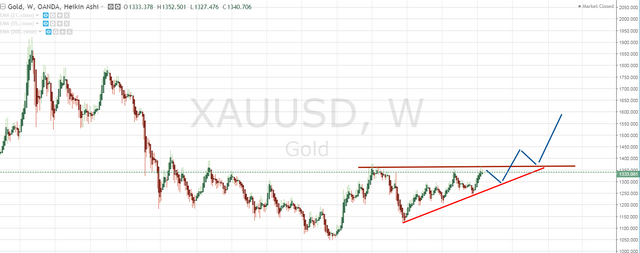
GOLD TECHNICAL ANALYSIS WEEKLY CHART

I did technical analysis on Gold on a weekly chart. It is in making of an ascending triangle. if it does break out on the top of the ascending triangle then it could reach near 1500-1600 level which is around 61% retracement of the down move.
NOTE: If anyone wants me analyze any specific forex, cryptocurrency or stock chart please let me know and will do my best to analyze it.
NOTE: I am not a financial advisor and this is for education and entertainment purpose only. This is not a trading advise and just my opinion, please trade at your risk and do your research.