Where next for the precious metals?
Most gold and silver bugs have probably become bored or perhaps even anxious over the price action of the precious metals for the past 10 months. After the initial surge from the first half of 2016 the precious metals have been meandering within a trading range. Don't be fooled however as this type of price action is nearly always a precursor to a big move. In this article I will be looking a little closer at the charts of the precious metals and related markets to assess the probabilities of either a bullish or bearish move.
Gold:
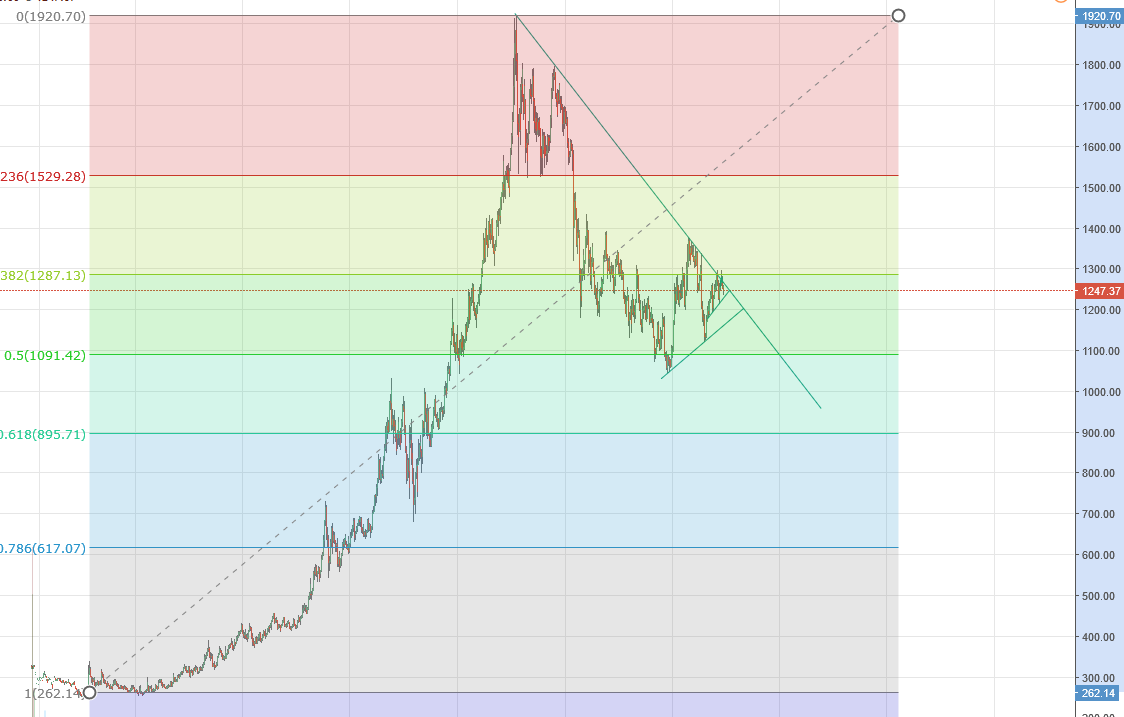
The super macro trend for gold is bullish ever since it became freely traded. The last surge in price occured from around $250 in 2000/2001 to $1900 in mid 2011. Following the initial capitulation after a parabolic move gold has stayed at around $1200 for the past four years, following a brief dip to the 50% retracement level of the entire bull run.
Zooming in:
There are several things which I think are important to note:
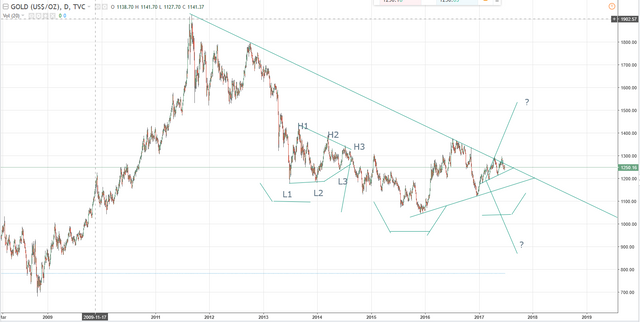
- The inverted triangle setup that occured between June 2013 and August 2014 was very choppy. It took over a year to reach its technical target, having many strong rallies and long periods of sideways movement. Everytime a new low was made it was marginally lower than the last, nothing like the original capitulation from 2012-2013.
- There appears to be an inverted head and shoulders pattern forming from the past four years of price action, and like many H&S patterns another triangle setup is forming on the other shoulder.
- To support the potential inverse H&S the initial six month surge of 2016 that negated the three years of grinding down took out the relative H3 and funnel of the 2013-2014 triangle pattern. To me this suggests a change in trend.
- Overall gold's bullish moves to the upside have been more impulsive and greater than the bearish moves when considering the entire 17 year time frame. To me this suggests that gold isn't 'dead' as some pessimistic people like to say.
Let's zoom in once more to analyse the triangle pattern forming.
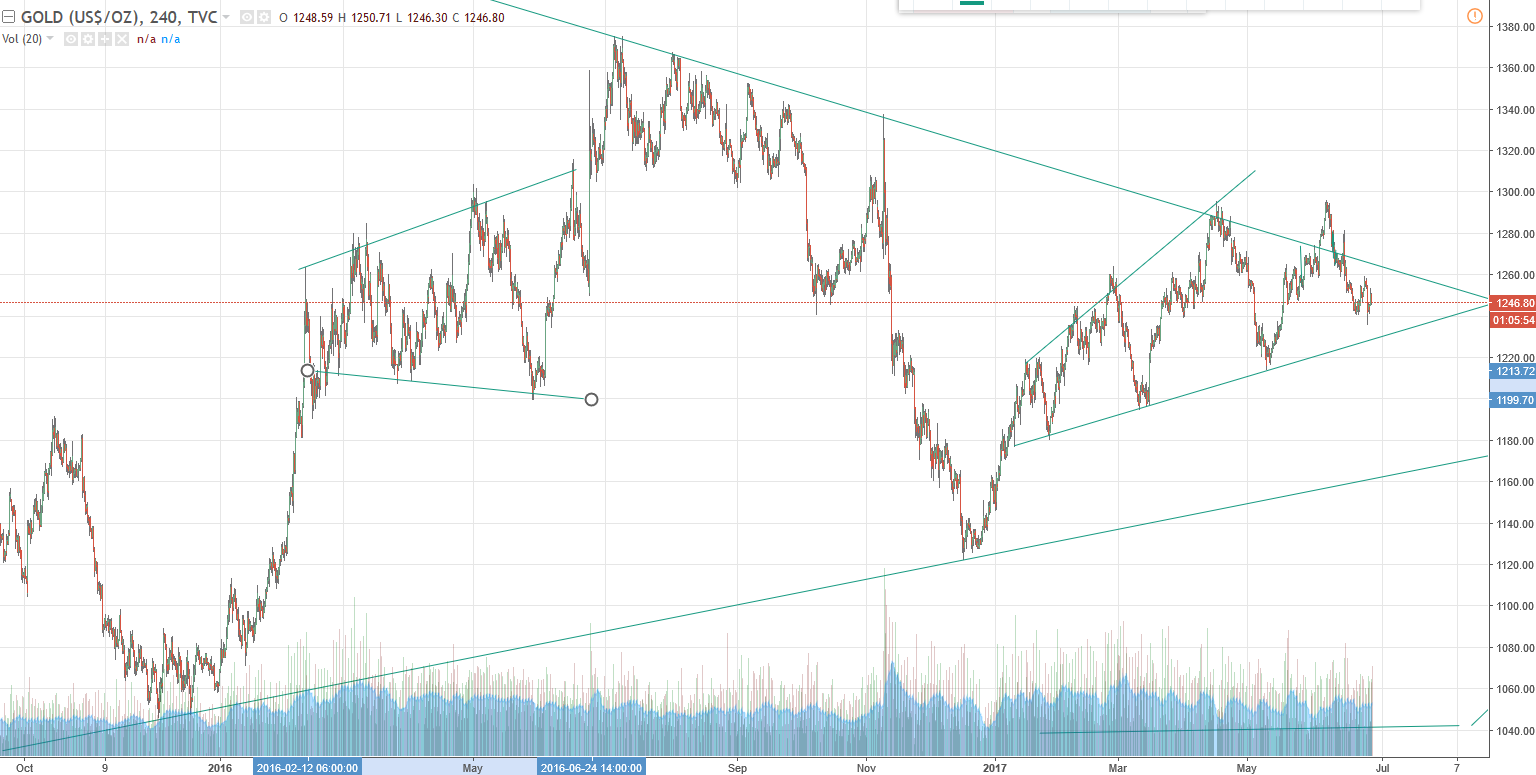
So far I've painted a rather bullish picture. However the price action for the consolidation in my opinion is a cause for concern.
- About the only thing positive is that the long term trend line from the 2011 high keeps getting retested which is sometimes a clue that there's a pressure building.
- Since June 2016 the down days have been much more capitulative and on higher volume than the up days. This is particularly apparent after the Trump victory and the grinding cone pattern from the beginning of 2017.
- Last month there was a false breakout that had a marginally higher high. This to me suggests that short term we're likely to test at least 1200 again.
The price action in platinum and silver is also giving warning signals:
Silver:
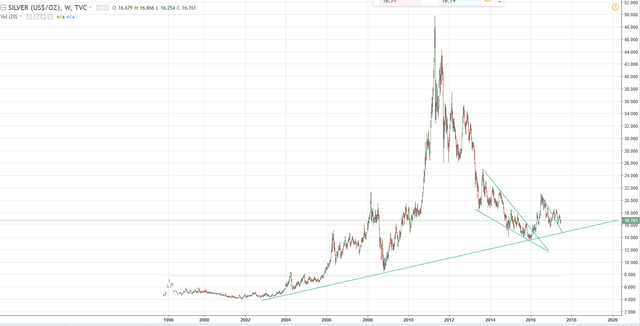
We see a similar long term perspective in Silver where the lows have been grinding down in the form of a wedge, followed by a impulse. The impulse happened to coincide with a long term trend line, adding to the idea that there may be a trend change. The more near term chart paints a more bleak picture however:
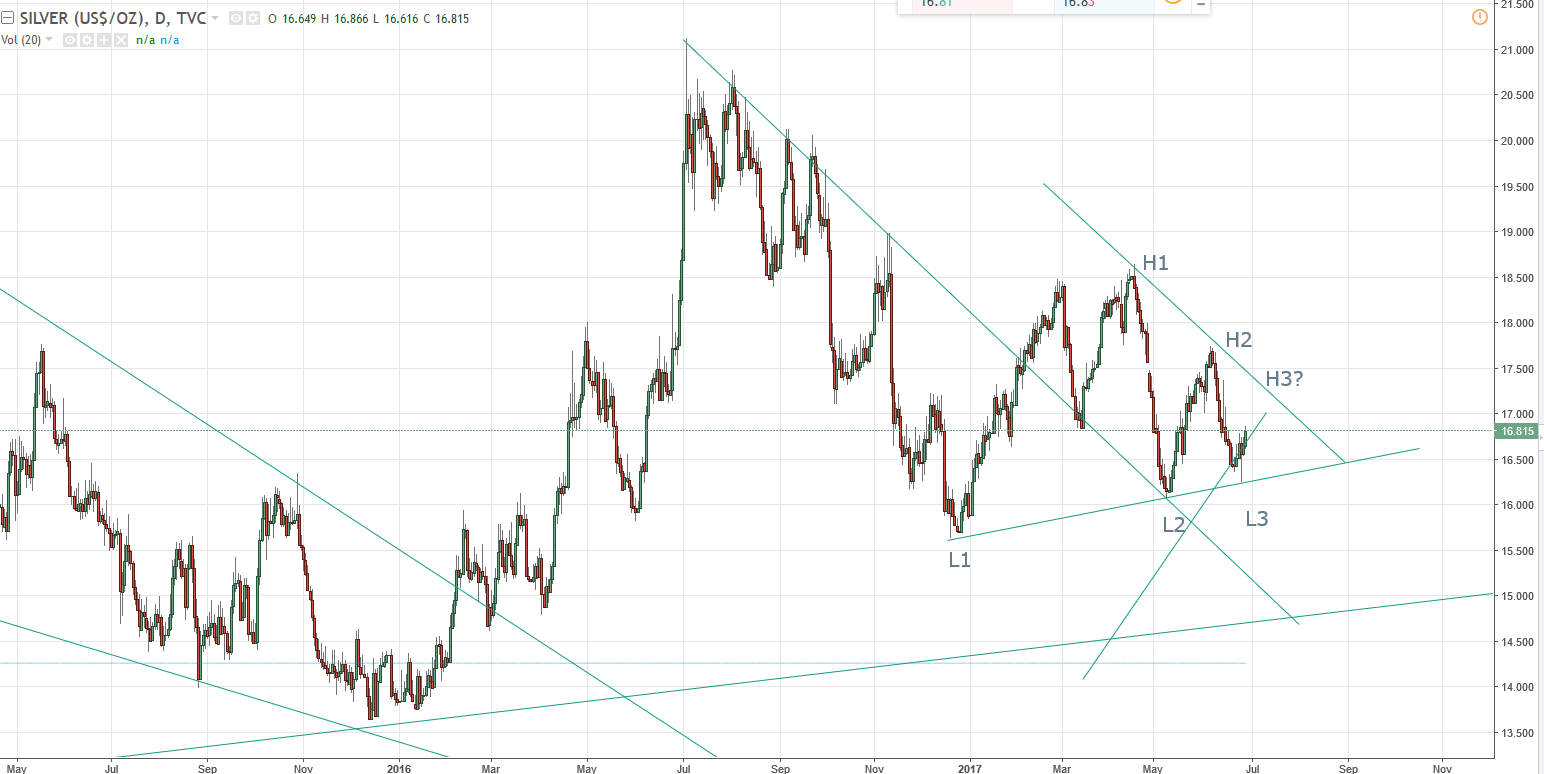
The initial impulse to $21 has always had capitulative selloffs thereafter. Like gold, silver is consolidating in a triangle pattern, however it looks much more bearish due to being very flat bottomed with even weaker uplegs. The technical target for the triangle would see a retest of the December 2015 low.
The gold/silver ratio however does look promising in the short term which may suggest a rally before any next leg down:
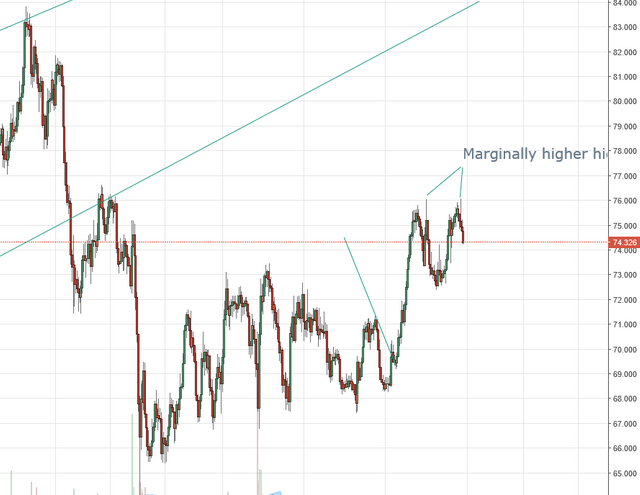
Note how there's recently a double top with a marginally higher high, both with big selling wicks. This was after the long term trend of the gold/silver ratio grinding up and then spilling hard - coinciding with the rally we saw in gold and silver. It looked like it was about to make another leg lower as the price action had a choppy 'rounded' look, although it turned out to be a setup to the upside.
Platinum:
Finally, with platinum there is yet a third confirmation of a move lower coming.
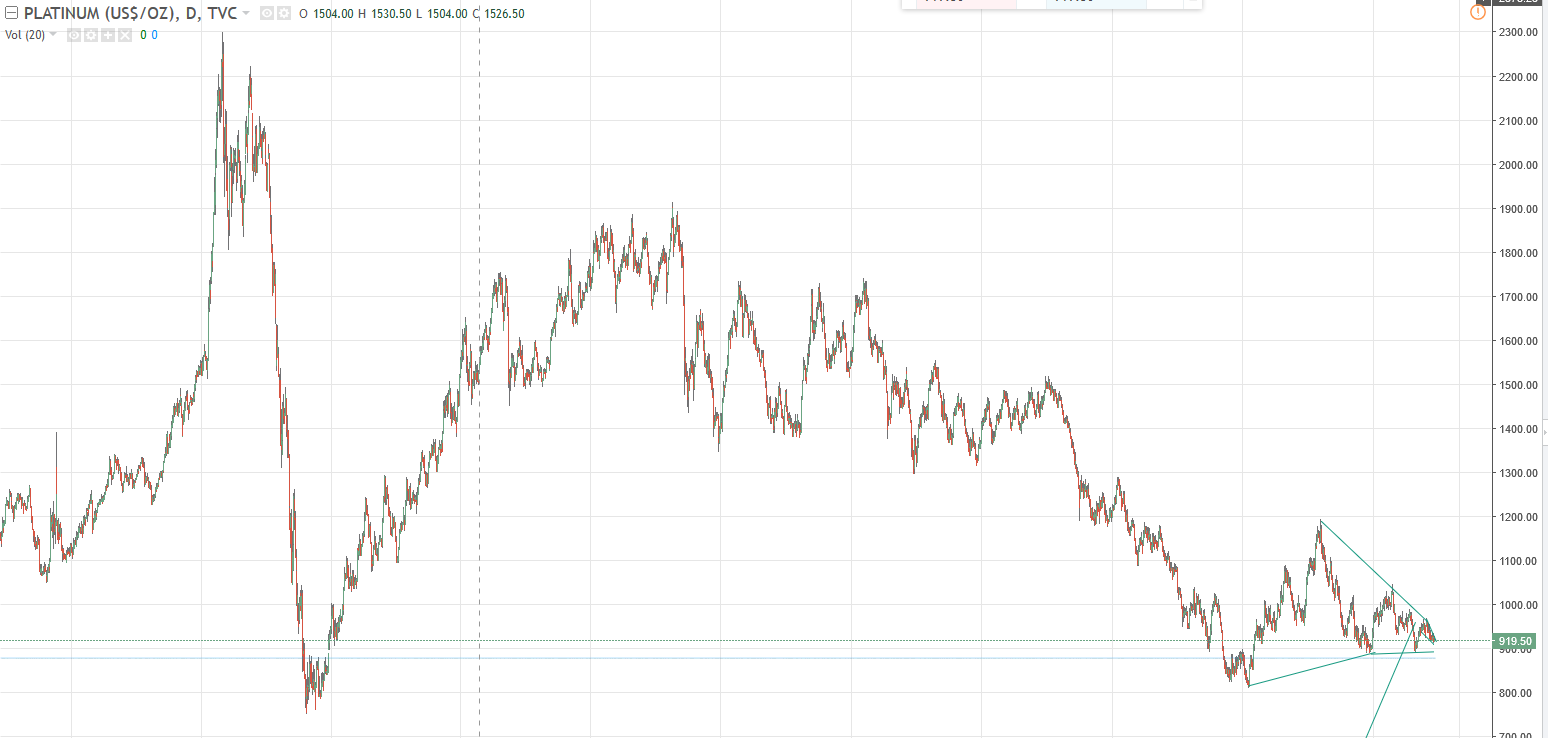
We can see the same flat bottom triangle setup just above the 2008 low - a key level of significance. The short term price action is in the form of a falling wedge meaning that this concurs with analysis of the gold/silver ratio that there maybe one last upmove before a breakout. Wedges can be directionally unreliable however so take it with a pinch of salt.
Speaking of wedges however, perhaps platinum may be a good purchase over gold:
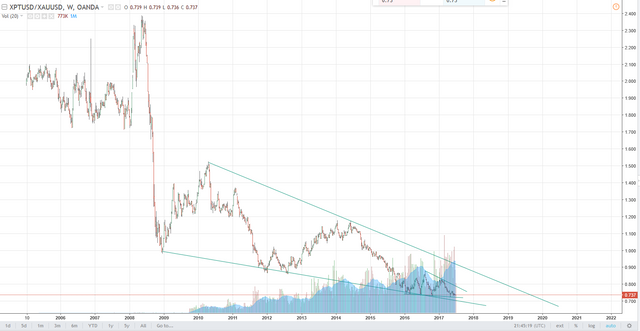
The platinum/gold ratio is currently at historic lows + it's in a falling wedge. A possibility that it could be the best performer out of a the three.
Related Markets:
Finally I'm going to share my thoughts on a few related markets to see if there are any more clues.
First off let's look at gold against the £ and the €
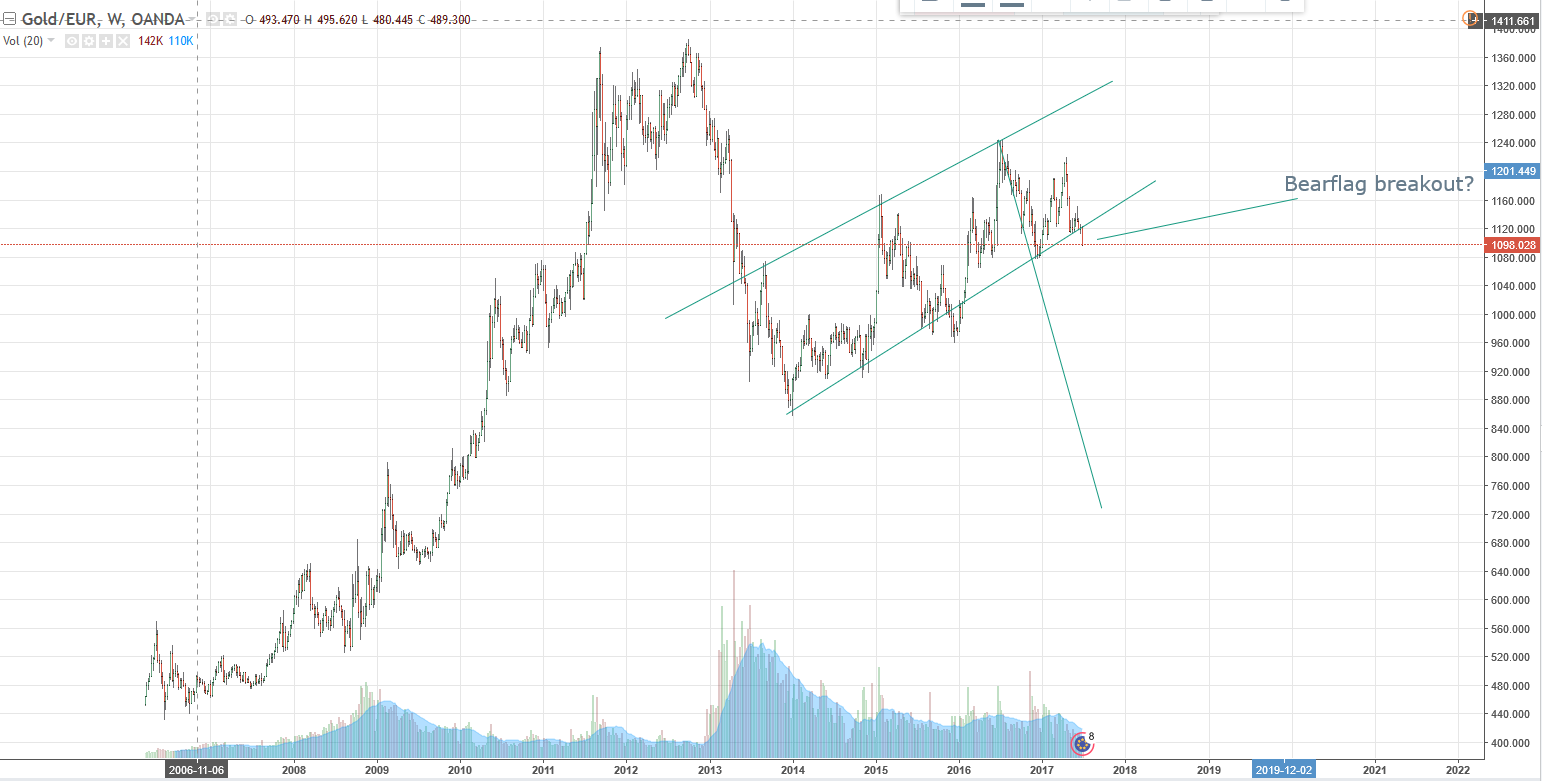
Potential macro bearflag which theoretically could take gold a lot lower. I don't place much weight on this however.
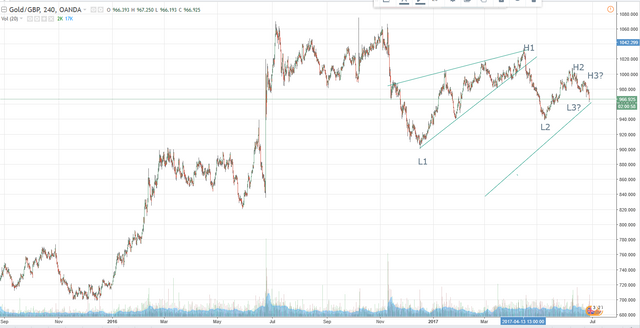
A clear shooting star followed by a capitulation after the trump victory. We then see the same triangle pattern forming with weak uplegs. The technical target will take us back to pre brexit vote, coinciding with a 61.8% fib retracement of the entire move from £680/oz.
OIL:
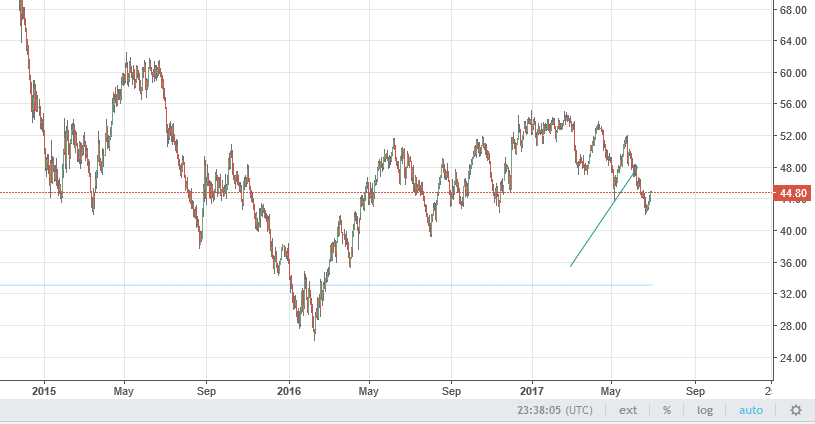
Commodity prices are related to oil since the oil price affects how profitable it is to mine them. After initially bouncing back from $27 there now appears to be a rounded top. If the oil bear continues it will almost certainly drag gold and silver prices with it. The gold/oil ratio is still hovering in the high range at around 28 barrels/oz which technically means that from a historic standpoint gold is overvalued relative to oil.
EURUSD
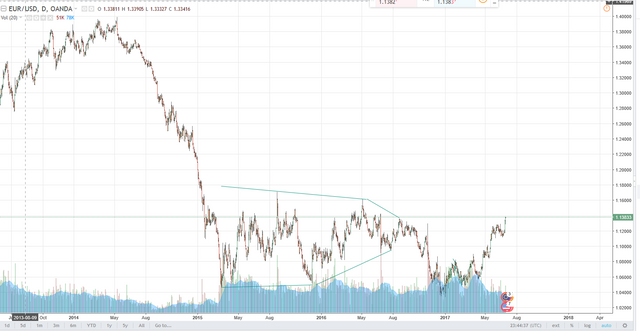
After initially looking like a parity run was going to happen, the triangle setup for the EURUSD ended with a marginally lower low after a several year long consolidation. After a H&S pattern, the macro triangle consolidation has now been invalidated which is bearish for the $. Since the euro and gold tend to be inversely correlated to dollar strength, gold may be dragged higher on the dollar weakness.
Conclusion:
My overall thoughts are that there is likely going to be a retest of the December 2015 lows considering all commodities have been looking weak despite a weak dollar. From a long term perspective however I think once this spell is over they will represent good purchases as it seems unfathomable that commodities and the US dollar will continue to be weak simultaneously forever.
Keep an eye out on the triangle patterns. Any sort of quiet price action followed by an explosive move, maybe even a rejection candle, should be conclusive about where the PMs will be going for the next 6-12 months.
I hope you've enjoyed my 360 degree market analysis. I'm interested to hear your thoughts.