Gold prices plummeted after several days of consolidation

The price of gold appeared to have fallen and formed a bearish candlestick in yesterday's trading. The price has fallen from a high of 2336 to a low of 2285 forming a harami candle.
According to analysts, gold prices fell due to improving risk sentiment and higher-than-expected increases in US labor costs. This sentiment is also supported by strong European GDP data.
Gold prices weakened lower than the $2300 level in Tuesday's trading in the US session. Positive sentiment reduces demand for safe-haven gold and data on rising US labor costs have negative implications for inflation and interest rates by the Fed.
The US Labor Cost Index showed an increase of 1.2% in the first quarter, above forecast expectations of a rise of 1.0% and 0.9% in the previous quarter.
Rising labor costs are synonymous with rising wages which can lead to rising inflation, and this could encourage the Fed to keep interest rates high for longer.
Technical analysis of gold today
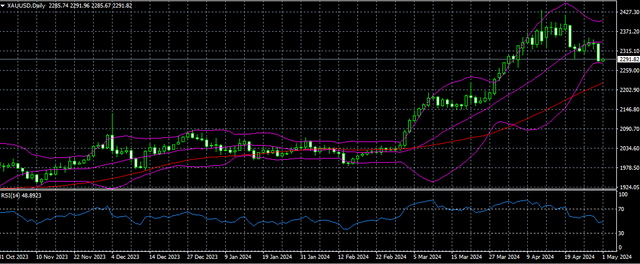
Gold prices fell and formed a Harami candle yesterday. Price is now near the lower band line which acts as dynamic support.
On the daily timeframe, the price of gold appears to be trying to rebound with a slight increase from a low of $2285 to $2291.
Here the Bollinger bands form a flat channel with narrowing bands indicating a sideways market with decreasing volatility.
MA 50 is far below the lower band line drawing an upward channel reflecting the market uptrend. This could be dynamic support on uptrend markets.
On the other hand, the RSI indicator points to level 48, the price is below the downtrend level.
H1 timeframe
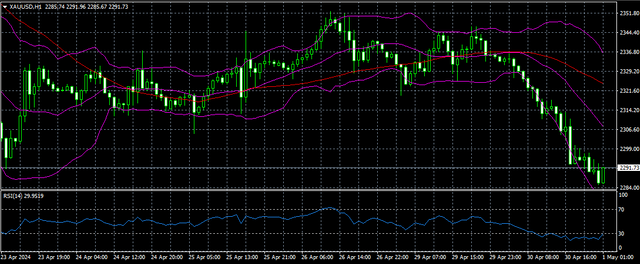
On this timeframe the price moves near the lower band line. Bollinger bands appear to be expanding, reflecting increased market volatility.
Price tries to rise by forming a bullish on the current last candle. MA 50 is between the upper and middle bands forming a downward channel indicative of a market downtrend.
While the RSI indicator points to level 29, the price is moving in the oversold zone.
Support and resistance
S3: 2274.74
S2: 2279.95
S1: 2283.13
PP: 2288.34
R1: 2291.52
R2: 2296.73
R1: 2299.91