This compelling visualization shows the inexorable buildup of climate-altering CO2 in the atmosphere, week by week - IMPORTANT: To stop your posts to be hidden by the flag trollers, just post on https://busy.org/
IMPORTANT: To stop your posts to be hidden by the flag trollers, just post on https://busy.org/
This compelling visualization shows the inexorable buildup of climate-altering CO2 in the atmosphere, week by week
By Tom Yulsman
CO₂ averaged about 410 parts per million in the atmosphere during the last week of March. Ten years ago, it averaged ~387 ppm in that week.
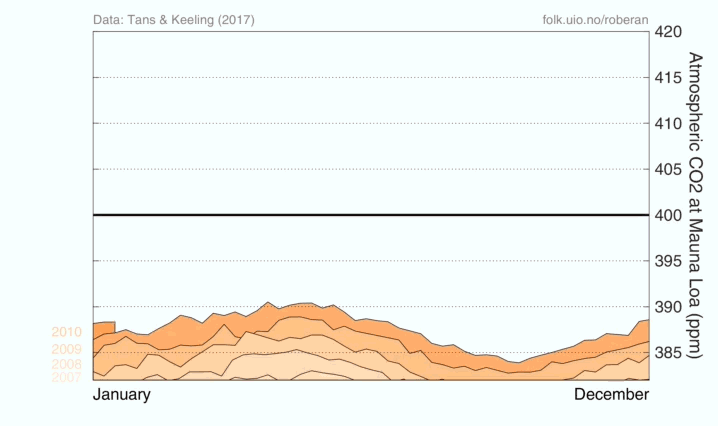
Increase of carbon dioxide in the atmosphere, as measured atop Mauna Loa in Hawaii. (Animation courtesy Robbie Andrew, CICERO Center for International Climate Research)
I spotted the animation above on Twitter the other day. It illustrates the growth of planet-warming carbon dioxide in the atmosphere in a novel and particularly compelling way, so I thought I’d share it here.
The animation shows how the concentration of CO2 in the atmosphere has changed week-by-week and year-by-year starting at the beginning of January 2010 and concluding in the last week of March this year.
I find the yearly buildup of layer upon layer to be a particularly compelling way of visualizing how we humans are fundamentally altering the chemistry of the atmosphere — and thereby causing profound, continuing impacts on our planet’s climate control system.
Lest any of you doubt CO2’s role in that system, I direct you to a story I wrote about that subject not long ago:
Here’s what real science says about the role of CO2 as Earth’s preeminent climatic thermostat
As climate scientist Zach Labe pointed out in recent his Tweet of the graphic, “CO₂ averaged ~410 ppm for the last week of March. 10 years ago it averaged ~387 ppm in that week. The annual maximum is typically reached in May.”
As the visualization shows, CO2 continues to build up inexorably in the atmosphere. But what about the rate of accumulation? Are we making any progress in slowing that?
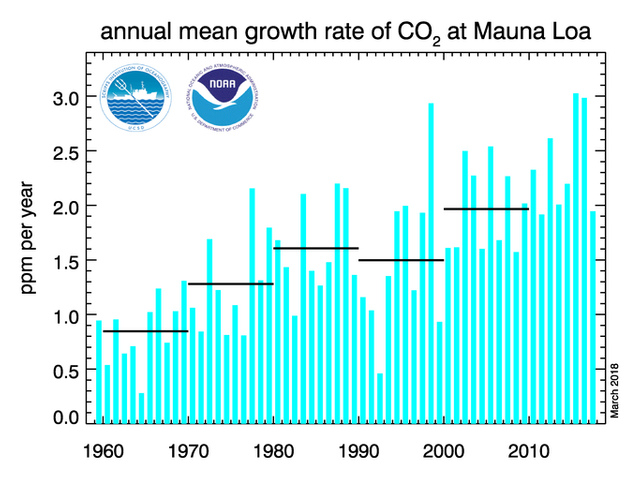
Annual mean carbon dioxide growth rates for Mauna Loa. Decadal averages of the growth rate are plotted as horizontal lines for 1960 through 1969, 1970 through 1979, and so on. (Source: Earth System Research Laboratory, NOAA)
As this graph from NOAA shows, it doesn’t look like it. The horizontal bars show what has been happening decade by decade to the annual mean growth rate in CO2 as measured atop Hawaii’s Mauna Loa peak — and that long-term trend is pretty clear.
The graph also shows that the CO2 growth rate set a record high in 2015, and it was almost as high in 2016. Recent research suggests that the strong El Niño event in 2015 and 2016 helped boost CO2 concentrations in the atmosphere during that period. After that, La Niña, El Niño’s climatic opposite, took hold. And 2017 saw a tempering of the CO2 growth rate. Will that continue?
Ultimately, it will depend on whether we humans manage to significantly reduce our emissions of CO2. Unfortunately, after three years of relatively flat global emissions — in 2014, 2015, and 2016 — we seem to be headed in the wrong direction now. Last year saw 2 percent growth in CO2 emissions worldwide, according to Glen Peters, Research Director of the Centre for International Climate and Environmental Research in Oslo, Norway.
“What’s caused that?,” he asks. “Primarily China. China’s emissions hopped up about three and a half percent in 2017, probably due to some economic stimulus from the Chinese government, and a dry year for hydropower.”
Less hydropower for producing electricity means more coal consumption. Moreover, “oil and gas continues to grow strongly in China,” Peters notes in an interview posted to Youtube by Carbon Brief. And the roughly 150 developing nations are experiencing about 2 percent growth in CO2 emissions every year. Continuing declines in U.S. emissions were not enough to offset the increase in China and the developing world.
Moving forward, “We can probably expect upward pressure on emissions,” Peters says.
This article appeared first on http://blogs.discovermagazine.com/
This post as well as its images are released under a CC BY 4.0 License
Don`t miss the top 10 best post(s):
On Busy.org (It`s better!):
On steemit:
On Busy.org (It`s better!):
On steemit:
On Busy.org (It`s better!):
Great art! Beautiful landscape on 2 beautiful women!
On steemit:
Great art! Beautiful landscape on 2 beautiful women!
On Busy.org (It`s better!):
On steemit:
On Busy.org (It`s better!):
Marvelous river with pink flowers on trees!!
On steemit:
Marvelous river with pink flowers on trees!!
On Busy.org (It`s better!):
Why eating meat contributes to deforestation in Latin America
On steemit:
Why eating meat contributes to deforestation in Latin America

On Busy.org (It`s better!):
On steemit:
On Busy.org (It`s better!):
On steemit:
On Busy.org (It`s better!):
On steemit:

On Busy.org (It`s better!):
On steemit:

@catfacts @banjo @witzbot @clever @cleverbot
This post as well as its images are released under a CC BY 4.0 License.
The best way to limit the abusers