Was It Worth It? - PC Tech Part 23 - AMD RX580 Reviewed & 12 Game & Mining Benchmarks!
AMD launched the RX 500 series cards back in April 2017, but how good are they 10 months later?
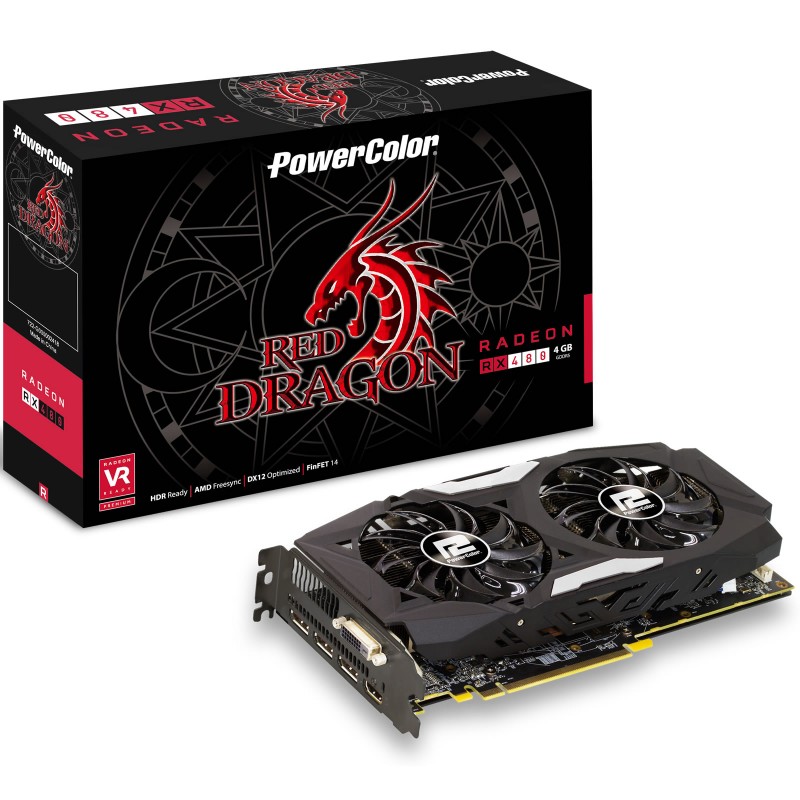
In 2017, Advanced Micro Devices (AMD), hit back at both consumers and rival companies with a full set of processors and graphics cards, bringing them back on top and gaining back a good portion of the market. Within all the new advances from AMD, came the Radeon RX 580 which was the replacement for the RX 480 and a Graphics card to go up against Nvidia's GTX 1060 and tickle the arse of the 1070.\
I have had my RX 580 for a few weeks now and I have had plenty of time to try it out on a fair few games, benchmarks and even mining with it. So here are my findings.
Before we get into the results of the benchmarks. Lets compare the specs of the card I have to the stock RX 580 and the stock RX 480.
| OC Powercolor RED Dragon v2 Radeon RX 580 | AMD Radeon RX 580 | AMD Radeon RX 480 | |
|---|---|---|---|
| Manufacturing Process | 14nm finFET | 14nm finFET | 14nm finFET |
| Transistor Count | 5.7 billion | 5.7 billion | 5.7 billion |
| Microarchitecture | Polaris 20 (GCN 4th gen) | Polaris 20 (GCN 4th gen) | Polaris 10 (GCN 4th gen) |
| Streams | 2304 | 2304 | 2304 |
| Compute Units | 36 | 36 | 36 |
| Core/Boost Clock | 1450 Mhz | 1257/1340 Mhz | 1120/1266 Mhz |
| Memory Clock | 2250 Mhz | 2000 Mhz | 2000 Mhz |
| Memory Size/Type | 8Gb GDDR5 | 4/8Gb GDDR5 | 4/8Gb GDDR5 |
| Memory Data Rate | 8.0 Gb/s | 7.0/8.0Gb/s | 7.0/8.0Gb/s |
| Memory Bus | 256 bit | 256 bit | 256 bit |
| TDP | 185 Watts | 185 Watts | 150 Watts |
So as we can see, when comparing the stock 580 and 480 remain almost identical, the improvements come in the new updated Polaris 20 microarchitecture which allows higher clocks at a lower temperature, the cards bios has been improved and the clock speeds are slightly better on the 580.
Out of the box the Powercolor RX 580 already has a slight increase over the stock 580, but I had to try and find its limit. Using a custom fan curve, I was able to get a steady core clock of 1450 Mhz and a memory clock of 2250 Mhz, any higher I would start to see artefacts on the screen. This has improved the frame rate in games by 1-5%, depending on which game I am playing. It may not sound like much, but it is an improvement regardless.
So what does this all mean for in game performance?
Considering the last GPU I had in this computer was a 2Gb R9 270X, the improvements in game were very dramatic. Apart from the huge increase in frame rates, I could now start to tune the graphic setting right up, while still retaining a decent frame rate.
The last card was on its last legs, and I even tried to repair it (You can read that post HERE), but I was unsuccessful in my attempts. So going from that to the 8Gb RX 580 was a huge leap. So much so that I now have a CPU bottleneck. This means I can not get the full potential out of the card because my ageing CPU can not handle the amount of data the GPU can produce, this is one of the reasons I have started to buy parts for my new gaming PC (You can read that post HERE). But regardless, I have still enjoyed this new GPU and I have got a few benchmarks for you to look at.
Here are the specs of my current PC...
| CPU | AMD FX-8320 Oc'd @ 4.3 Ghz |
| Motherboard | Gigabyte 990-FX DS3 |
| Memory | 8Gb Corsair Vengeance Oc'd @ 2200 Mhz |
| Graphics Card | Powercolor Red Dragon v2 RX 580 8Gb |
| Cooling | Corsair H55 120 AiO, 2 x 200mm case fans. 5 x 120mm case fans. |
| Storage | 8Tb HDD's |
| Power Supply | GameMax 1050Watt Modular Silver+ PSU |
| Case | NZXT Phantom 80 Full Tower. |
And here are the Gaming Benchmark Results...
| 1080p | 1440p | 2160p | |
|---|---|---|---|
| GTA V | 76.3 | 58.8 | 34.1 |
| Hitman 2016 | 58.3 | 54.2 | 37.2 |
| Rise of the Tomb Raider | 78.0 | 58.9 | 32.8 |
| Alien Isolation | 162.0 | 112.5 | 52.2 |
| Metal Gear Solid V | 62.5 | 54.7 | 27.1 |
| Eve Online | 129.4 | 74.8 | 41.5 |
| Unigine Valley Benchmark | 59.2 | 33.8 | N/A |
| Unigine Superposition Benchmark | 44.0 | 26.6 | 7.8 |
| Cinebench Open GL | 350.2 | N/A | N/A |
GTA V
By now when anyone benchmarks a card when reviewing or comparing it to another, it is a given that GTA V with its built in Benchmark tool, is the first go to game to get an accurate reading on what a GPU is capable of, and with this card, that statement rings true. With everything turned up to Very high and Ultra with usual suspect turned off, at 1080p, the card performed very well at a steady 76+ FPS with the occasional dip down to the high 60's. At 1440p it was again a strong result at a tad under the 60FPS most gamers aim for as an absolute limit when playing. But in the 4k test, we started to see huge falls in frame rate, down to 34 with lows in the 28FPS area, although it was still smooth, it is noticeable when comparing to the 1440 test.

Image Source
Hitman 2016
Hitman is by far one of my favourite game franchises of all time next to metal gear, and with this game being an AMD sponsored title, I was expecting it to do very well. Unfortunately it did not live up to expectations. With everything set as high as it will go with everything turned on, in the 1080 test it gave a reasonable 58 FPS, not bad, but not great by any means, so I suspected there maybe something else at work here resulting in the low FPS, and sure enough, when I completed the 1440 test, which gave me 54.2 FPS, I would say that the bottleneck lies with the CPU not being powerful enough to process the data fast enough. Next came the 4k test which was a very playable 37 FPS, but nothing like what I was expecting.

Image Source
Rise of the Tome Raider.
This was a very interesting test to say the least. With Riva Tuner on, I can observe everything from GPU load, how much system memory is used to individual core temperatures on the CPU. Although the test results were not all that unexpected with everything turned up and on, it was the system that was confusing me the most. Let me explain, at 1080, I got a steady 78 FPS, but I noticed that the CPU was at full load and GPU was only at about 40-50% load. At 1440 I got a good 54 FPS, but the GPU load had increased to 100% and the CPU was still at 100%. the 4k test yielded an OK 32 FPS, but now the CPU load had dropped to under 20% with the GPU still at 100%, you would think with the increase in image size, the CPU would become under greater load, not decrease. But then again, Tomb Raider has some funky characteristics when pared with older hardware.
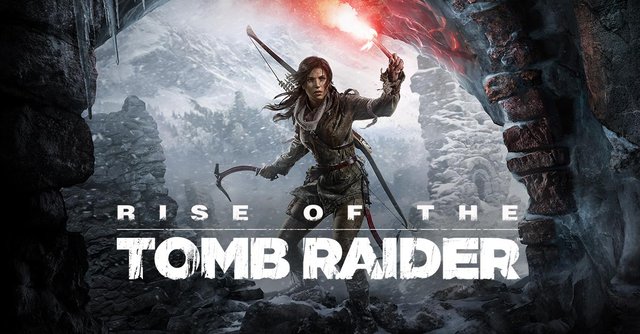
Image Source
Alien Isolation.
Since I got my new headset (@Deeviras will write a product review about them soon) I have been playing more and more Alien Isolation. Previously, I played for a few hours, left it alone for a few months and then restart the game thinking I will complete it, but that has never happened until recently and with the headset, I am in love with the game. As with everything else in this list, everything was turned up and on, and despite this, I was getting incredible results. 1080 I got over 160 fps consistently and my monitor can only handle up to 100, so I was very impressed. The same can be said about the 1440 test with over 110 FPS, and to top it of, the 4k test gave a very playable 52 FPS and it looked epic. And I usually play at the 1440 setting. Think I may go 4k from now on.
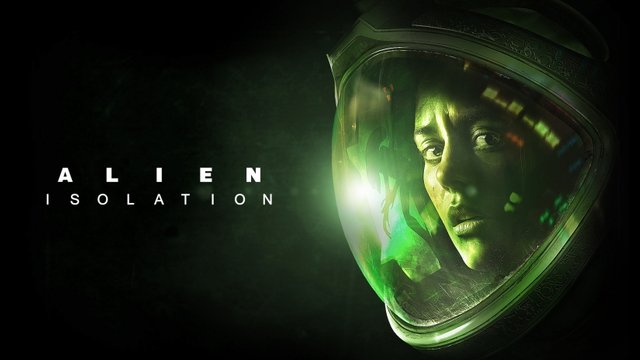
Image Source
Metal Gear Solid V.
I have played this game over and over so many times it is untrue, but I have never really benchmarked it before now. This was mainly due to the old card I had in this system, it was a case of finding a setting that didn't make the game stutter. Thankfully the RX580 can let me really test what the game is capable off, and it didn't disappoint. 1080 was a very smooth 62 FPS, even during massive explosions that would otherwise render games unplayable. At 1440 only saw a small drop down to 54 FPS and was still silky smooth and consistent, however at 4k the demand on the card became too much and it dropped to under 30 FPS and was almost unplayable, but it was consistent regardless.
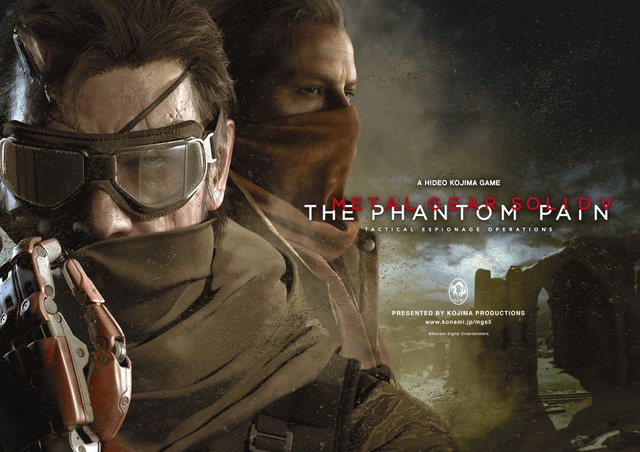
Image Source
Eve Online.
I downloaded this game a couple of years ago with the intention of playing it more than what I did. Think total game play stands at 14 hours in this game, which is not an awful lot of time, but I digress. I figured it would be a good example of how a popular online game can perform with this hardware. 1080 was a spectacular 129 FPS with hardly any dips below 120, even during dog fighting in an asteroid field. 1440 was at a very playable 75 FPS and it still looked stunning, and 4k dropped down to 41 FPS. So even though the settings were maxed out, the game was very predictable when scaling up. I will at some point spend more time playing this game, maybe after I complete Isolation.
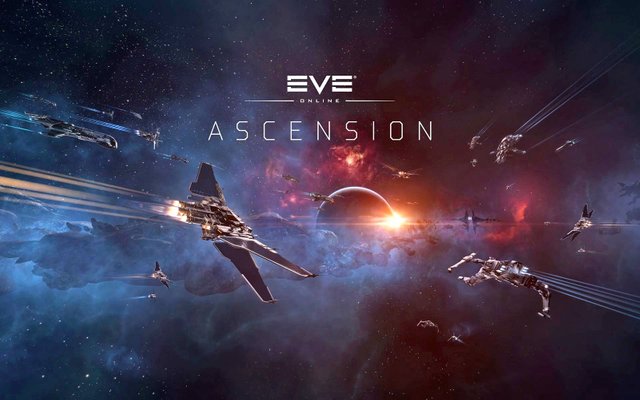
Image Source
Synthetic Benchmarks.
Unigine is another go to source for a standard benchmark to determine hardware performance, and they have several such benchmarks in which to choose from. I chose the 2 most recent benchmarks, Valley and Superposition.
Valley is quite possibly the most beautiful benchmark software I have come across and a good way to see how much tessellation your GPU can handle, as there is a mountain of it in this. At 1080 I scored just under 60FPS at the highest settings, and at 1440 I got a predictable 33 FPS. There is no 4k test in this benchmark, but we can predict the 30 FPS in the 1440 would be halved down to 10 – 15 FPS.
Superposition is a very demanding benchmark that can even put the best systems under extreme load. And this was the only test were I had to go from Ultra/Very High down to High, just so I could get a 4k score and keep everything consistent. 1080 saw a good 44 FPS, then the 1440 test got 26.6 FPS and the 4K got a dismal 8 FPS. But this was designed to put those systems that cost 10k + to the test, so I am surprised I got a good of score as I did.
At the end of all these tests, I decided to through in an open GL test from Cinebench R15 in there for good measure. It only ever tests in 1080 and I scored well over 300 FPS for this test.
Image Source
Mining.
For those of you who are not all that much interested in game performance, I did a couple of benchmarks with some different coins. When I first got the card, I installed the standard drivers and went to work. When mining Ethereum I was only getting about 20 mhs if I was lucky. I know the card could perform better, and I found out that AMD has a mining specific driver. So after some faffing about I got it working as it should.
Ethereum mining with the Claymore miner was getting very consistent 27 mhs, after the memory was overclocked to 2250Mhs, up from 2000Mhs.
Monero was getting on average about 690 hs and Zcash was getting 290 hs.
At present during my computers down time, I have a second boot OS with the mining drivers installed and it mines Ethereum as it is the most profitable at present.
You can read more about my mining shenanigans here
So with all the tests complete and after the time I have had with the Radeon RX 580 8Gb, I can honestly say that I am very much enjoying how well it performs considering the ageing system that its in. all my favourite games are performing much better than what they did on the older GPU.
Even though this card cost almost double its normal retail value, I am very pleased with its performance, and in my new Gaming PC, I will be buying another to pair them up in crossfire for a performance boost, instead of going to the extra cost of buying a Vega 64, but this is totally dependant on the state of the market when it comes time to buy another.
In conclusion, a fantastic card that can perform in most modern games and obviously a great card to mine with too. Just the price for that performance is a little too steep, but if you can find one at a good enough price, get it. You won't be disappointed.
Thanks for reading.
Don't Forget to Upvote, ReSteem and Follow for more content like this!
Stu @TechMojo
Join the chat TechMojo Discord Channel Follow us TechMojo OnG Social Page Like us TechMojo Facebook Page Follow us TechMojo Twitter
@TechMojo Recommended Blogs you should follow.
@Deeviras @Gaming-Stuff @retro-room @gingerninja @Rerez @gamesociety @XYZposter @deadspace @TechBlogger @C0ff33a @XR-HammerGaming @grownfolksgaming @Free999Enigma @GeekClub @tygergamer
Like this Content? Why Not Donate Then.
Bitcoin Wallet Address. 1L8TZDQasoBU2RNcjkSeZX3iUsSaHT37aj Ethereum Wallet Address. 0xe3c6372121554f73c38acae3312fc7b1ddaf670f



I have followed your blog quite a long time ago. Nice share.