FX Trading AUDUSD
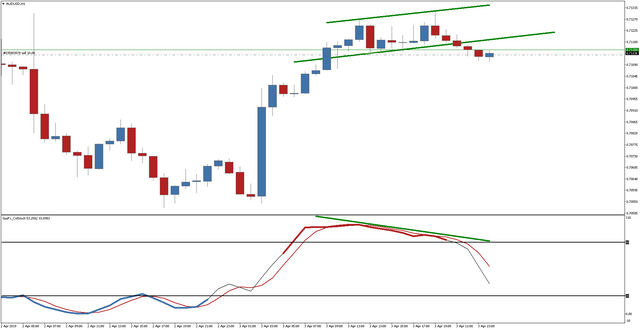
I teach you how to trade the FX market using no more than simple trendlines and the Stochastic indicator. My latest trade opened this morning in the AUDUSD is presented below. First thing to note is the divergence between price action and Stochastic. Notice that whilst prices continue higher, as shown by the upper trendline, Stochastic is moving lower. This is known as divergence, and is indicative of an impending price downtrend. Secondly, note that price action has crossed below the lower trendline at around the same time that Stochastic crosses down and moves below the 80 level. This is a very clear sell signal, resulting in me selling 10 contracts. I'll keep you posted with updates.

Here's how my trade looks at close on Friday. Currently showing an unrealised profit of $451.50, but seems to be settling into a sideways pattern. Stochastic suggests an upside price breakout early next week, but we are still below the original breakout level (lower trendline). Note also the extended divergence between price action (angled upper trendline) and Stochastic, which favours continued downside continuation. The Reserve Bank of Australia (RBA) left interest rates unchanged at its last meeting, against some expectations of a rate decrease. When this failed to materialise prices bounced higher initially, before settling into the current sideways pattern. But the RBA can't delay the inevitable forever, and my expectation is the Aussie Dollar will continue downward for a little while yet. Look at the AUDUSD 1-hour chart and the 4-hour charts! The Aussie's going down!
Closed out my sell trade with a $1,730 profit. Will sit on the sidelines for the time being and see what comes next. My previous trade on 2 April made a $2,570 profit...$4,300 in two days!
Nice Trade Gaz. You must be very rich 😎😎