Free Download: Excel Spreadsheet that Calculates Risk for Leveraged Trades, Also a Useful Tool as a "Trade Journal"
CLICK HERE to have the option of downloading one of my most used trading tools (on the risk analysis and trade planning side of things), an excel spreadsheet, titled Weekly Market Attack Plan Template. I'll go into what it is and how to safely download it below.
What is It?
It's an excel spreadsheet that's set up as a type of trade journal, which has tabs for pasting charts (provided with comment sections for each chart-paste area) and a very useful risk calculator for leveraged trades in bitcoin.
Because I use this spreadsheet for trading at an online bitcoin brokerage called 1Broker, it's set up to deal with converting bitcoin prices into $USD prices, taking the trade type (long or short) and trading leverage of the position (anywhere from 1x to 200x leverage) into account. I already made a post about why I think 1Broker is the best bitcoin brokerage option in a Steemit post titled The Best Options for Bitcoin-Based Stock/ Forex Brokers (pros and cons), if you're interested. You can click here (referral link) to sign up for a trading account at 1Broker (requires only an email verification and is free of charge).
What's Included in the Spreadsheet?
The spreadsheet consists of five tabs:
1.) Notes
This tab is set up as a trade journal entry that lays out the general (broad scope) trading plan(s) for the upcoming week. It consists of five text boxes for comments and a heading box to highlight the week in question. Below is an image demonstrating what it looks like and one way to use it.
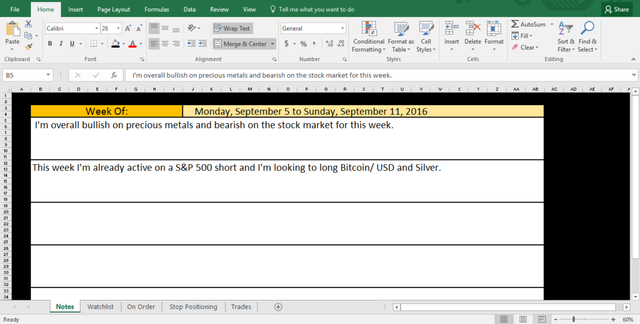
I like to use each text box like a paragraph separator (separating different sets of topics/ ideas). If something big should occur in the market sometime within this week, like the Brexit event which occurred fairly recently, then I'll note that in one of the currently blank boxes.
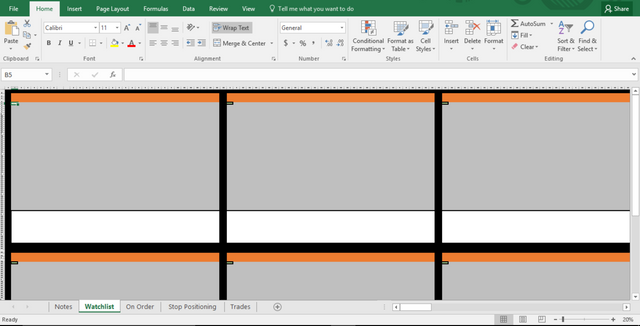
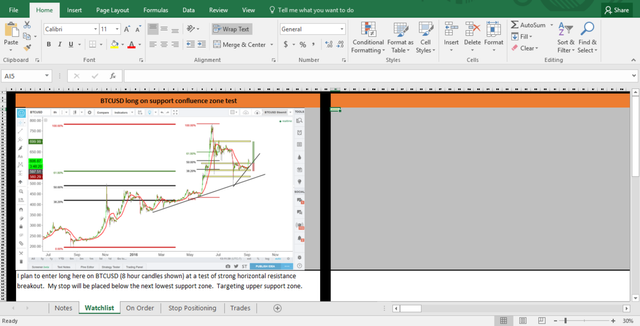
2.) Watchlist
This tab is set up to paste charts (screen-captured from our trade chart software/ website of choice) of our trade candidates for the upcoming week, and/or markets that we think might have a chance to develop into an attractive trade set up sometime within the next week. Each area for pasting a chart has a text box assigned to it, allowing for us to detail out why we consider it a viable trade and how we're approaching the trade from an entry and exit standpoint.
Below is an image of how this tab looks when empty, followed by another image that gives an example of what pasting a chart (in may case from TradingView.com looks like.
3.) On Order
This tab looks exactly the same as Watchlist and is meant to be used as a section to lay out all the trades that we have on-order through our brokerage. These are trades that may not execute (if the entry price isn't reached), but they still have risk tied up in them due to the fact that they can become actual positions at some time along the week.
4.) Stop Positioning
This is my favorite tab, the one I get the most use and value from on a daily basis.
The spreadsheet on this tab allows us to calculate how much money (bitcoin) we have to put up for risk in order to get our desired stop risk. If, for example, we desire to risk $100 on our stop (set up the trade so that $100 is lost if our stop is hit) and we wish to use 5X leverage on the trade, and we know that bitcoin is currently trading at $600, we enter these values in their respective cells. If this is a long position, entering all the above values will produce a position cost of about 0.4494 bitcoins. This example is shown in the below image.

5.) Trades
This is probably the most important tab from a trade journal perspective (as a way to look over past trades and reasoning).
The tab, itself, has a layout that exactly matches both the Watchlist and On Order tabs. It's purpose is for saving the charts of trades that have actually executed and detailing how the trade worked out (was the stop or target hit? did we decide to sell the position before either the stop or target were hit, and why?), what we think we did correctly and/or incorrectly, how we may approach similar trade set ups in the future, etc.
Keeping a record of our trades in this manner allows us to both see our results, whether positive or negative, and pick up on any trade habits that may be leading to poor/ good results. This may be used to learn lessons from our past trade behaviors/ tendencies, providing us with a useful tool to spot our trading weaknesses/ strengths. It is also a valuable gauge for how effective our new approach is after tweaks, should we decide to change our trade method(s) anywhere along our path.
Are You Interested?
If so, I provide you with details on how to download this excel file to your own computer, wherein you'll have total control to use the spreadsheets as I made them and change them in any manner that suits you.
How to Download the Excel File
1.) Go to the following web address:
This brings you to Microsoft Onedrive, a cloud sharing service that Microsoft provides for Microsoft Office 2013 (and later) users. However, you don't have to use Microsoft Office 2013 (or later) to use or modify this file. Even the freely downloadable and free-to-use knock-off of Microsoft Office, called Open Office (http://www.openoffice.org/), has an excel program that will work fine.
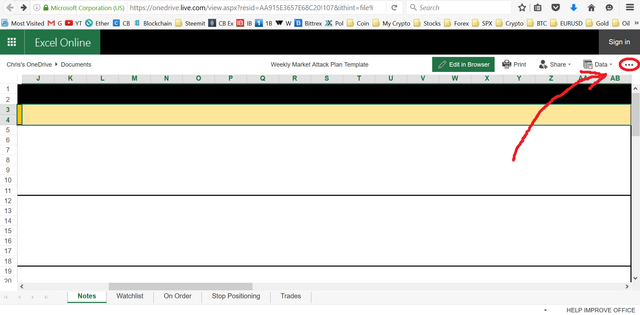
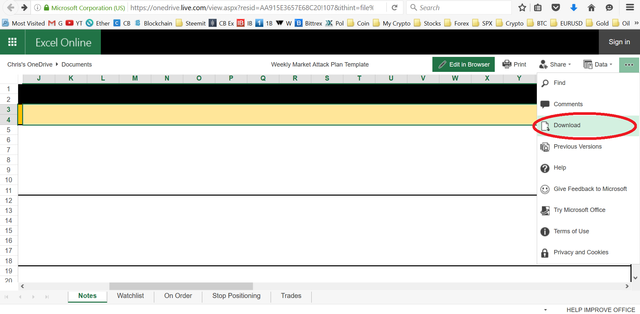
2.) Click on the pull-down menu that provides you with the download option (highlighted in the circle with the arrow pointing to it in the image below):
3.) Click on the download tab from that pull-down menu (circled in the below image):
4.) Be sure to scan the file for viruses before downloading (always the safest/ smartest practice when downloading) and don't forget to save the file to your hard-drive after you've downloaded it.
That's It!
Now it's yours to play around with and change in any way that you wish. You're free to use it and share with others (even for profit!). Most importantly, you may use it as a tool to log your trades and quickly calculate out your risk on your stops/ trade entries.